EUR/USD Weekly Forecast: Jobs Data Fuels Fed Cut Pressure

  • The EUR/USD weekly forecast suggests continued dollar weakness.
  • The nonfarm payrolls figure came in significantly below estimates.
  • Traders worried about a looming election that could throw France into political chaos.

The EUR/USD weekly forecast suggests continued dollar weakness as employment data puts pressure on the Fed to cut rates.

Ups and downs of EUR/USD

The EUR/USD pair had a bullish week as the dollar collapsed amid downbeat US employment figures. However, the euro also came under pressure due to political uncertainty in France.

Are you interested to learn more about MT5 brokers? Check our detailed guide-

Data throughout the week on US job vacancies, private employment, and unemployment claims revealed unexpected softness in the labor market. Additionally, the nonfarm payrolls figure came in significantly below estimates, leading to a surge in expectations for a Fed rate cut and a decline in the dollar.

Meanwhile, the euro was fragile as traders worried about a looming election that could throw France into political chaos.

Next week’s key events for EUR/USD

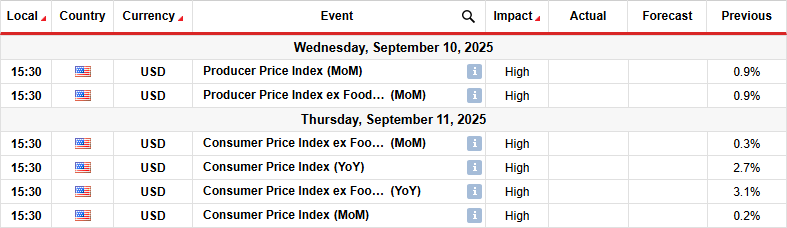
Next week, traders will focus on inflation data from the US. The CPI and PPI reports will show the state of consumer and producer prices. In the previous month, the CPI report revealed soft figures that boosted bets for Fed rate cuts. Market participants were more convinced that Trump’s tariffs had little impact on price pressure.

Another downbeat report will support the current trend of poor employment figures, boosting rate cut expectations. On the other hand, if inflation is hot, rate cut bets will ease, and the dollar will recover.

EUR/USD weekly technical forecast: Bulls approach the 1.1800 resistance

EUR/USD weekly technical forecastEUR/USD weekly technical forecast
EUR/USD daily chart

On the technical side, the EUR/USD price trades above the 22-SMA, with the RSI above 50, suggesting a bullish bias. However, the price action also shows that bulls are struggling to detach from the 22-SMA. Moreover, they are facing solid resistance at the 1.1800 key level.

Are you interested to learn more about Thailand forex brokers? Check our detailed guide-

Initially, the price pierced the SMA, showing bears had gained momentum. However, the price failed to break below the 1.1400 support level. Here, EUR/USD made a morning star pattern, showing bulls would take back control. Soon after, the price broke above the 22-SMA.

However, bulls must now break past the 1.1800 resistance level to continue the previous bullish trend. Such a move would solidify the bullish bias. On the other hand, if the resistance holds firm again, bears might return to challenge the prevailing trend. A break below the 1.1400 would confirm a reversal to the downside.

Looking to trade forex now? Invest at eToro!

68% of retail investor accounts lose money when trading CFDs with this provider. You should consider whether you can afford to take the high risk of losing your money.

Source link

Visited 1 times, 1 visit(s) today

Related Article

USDJPY daily chart with 148.70 key support and 151.24 key resistance

USDJPY Breakout Has 400 Pip Potential (Complete Trade Plan)

Is USDJPY about to rally 400 pips? Watch today’s video for the details, including key levels, a Time Price Opportunity (TPO) analysis, and targets. I also share the latest on the DXY and Japanese yen basket, so you have a complete USDJPY trade plan. USDJPY is breaking out this week after two months of sideways

Pills laid out in the shape of a dollar sign.

Does This Acquisition Make Pfizer Stock a Great Buy?

There’s an opportunity to get in on the weight-loss drug craze at a reasonable price. Remember Pfizer (PFE -1.68%), the giant pharmaceutical company that developed a COVID-19 vaccine within weeks of the pandemic hitting U.S. shores and got it approved within a year? It was the fastest vaccine development in history and a miracle of

S&P 500, Nasdaq fall as US slowdown fears persist — TradingView News

Wall Street set for lower open as investors reassess rate-cut hopes — TradingView News

By Niket Nishant and Sukriti Gupta Wall Street’s main indexes were set to open lower on Thursday, as fresh economic data and remarks from a Federal Reserve official tempered optimism around further rate cuts. The moves reflect a broader sense of caution ahead of Friday’s release of the Personal Consumption Expenditures index, the Federal Reserve’s

Laura Bratton

Dow, S&P 500, Nasdaq fall after back-to-back losses, jobless claims dip

US stocks fell Thursday as Wall Street assessed an unexpected decline in jobless claims, complicating the calculus for interest rate cuts amid uncertainty about Federal Reserve unity on policy. The Dow Jones Industrial Average (^DJI) dipped about 0.3%, and the S&P 500 (^GSPC) lost 0.6%. Meanwhile, the tech-heavy Nasdaq Composite (^IXIC) fell 0.9%. The declines

無綫新聞 TVB News

Sichuan’s High-Tech Industrial Development Zone records GDP of nearly 350 billion yuan

發佈日期: 2025-09-25 20:10 TVB News 粵 已複製連結 The High-Tech Industrial Development Zone in Sichuan province’s Chengdu, recorded a total GDP of nearly 350 billion yuan in 2024. Enterprises established in the area include Aerofugia and Adaspace Technology. This is AE200, a manned eVTOL aircraft developed by Aerofugia, an aviation enterprise under the Geely Technology Group.

Euro Currency Trading Concept Illustration with Forex Line Graphs and Fifty Euro Banknotes. Trading Business Concept

Forex trading: How does it work – and is It worth trying in 2025?

It wasn’t so long ago that trading was considered a niche activity that little was understood about by the masses – but fast forward to today, and a growing number of affluent individuals are dipping their toes in in the hopes of securing enhanced financial freedom and long-term wealth. As trading becomes more accessible than

NZD/USD Analysis 25/09: Mid-Term Lows Challenged (Chart)

NZD/USD Analysis 25/09: Mid-Term Lows Challenged (Chart)

Created on September 25, 2025 The NZD/USD is trading near the 0.58190 level this morning as the currency pair has made fresh near-term lows and is within sight of important mid-term support. The NZD/USD was able to rise and touch the 0.60000 level last Wednesday, this in the midst of the announced interest rate cut

USD/ILS Analysis 25/09: Sideways Price Action (Chart)

USD/ILS Analysis 25/09: Sideways Price Action (Chart)

Created on September 25, 2025 The USD/ILS is near the 1.35440 mark as of this writing depending largely on a rather wide spread regarding bids and asks this morning, essentially providing sideways price action in a cautious Forex market. The value of the USD/ILS is around the 1.35440 vicinity this morning depending on the quote