EUR/USD Price Recovers as Geopolitical Tension De-escalates

  • The EUR/USD price sees a fresh buying wave as geopolitical tensions de-escalate.
  • The ECB’s shift of tone may provide an additional boost to the euro.
  • Market participants are eyeing the FOMC meeting this week.

The EUR/USD price maintains a strong bullish momentum despite the Middle East tension that weighed on the pair on Friday. The price stays above the mid-1.1500 area through the early European session.

-If you are interested in forex day trading then have a read of our guide to getting started-

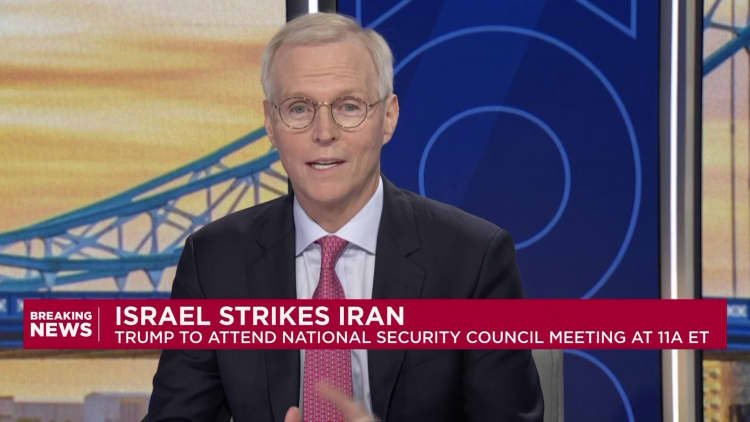
After a renewed strike between Israel and Iran, US President Trump urged both countries to make peace. Earlier, the markets saw a turmoil amid Israel’s attacks on Iranian nuclear and military facilities, killing many. The retaliatory attack by Iran also killed civilians in Israel. Global stocks plummeted on Friday.

However, European stocks have started the day on a positive note, as the probability of heading to the peace is higher for now. The US dollar comes under pressure as the risk appetite improves.

On the trade front, last week’s US-China trade talks boosted the risk sentiment. More negotiations will be carried later that could result in reaching mutually agreed terms. Hence, the risk assets may see a rally.

This week’s most important event is the FOMC meeting, where markets expect no change in the interest rates. However, the policy statement by the Fed Chair is key to watch, as clues about future guidance to the rate cuts can be found.

On the other hand, the ECB’s Nagel commented today that the central bank is flexible and is not going to signal a pause or a rate cut due to the higher amount of uncertainty. He also said that the ECB has already accomplished its objectives and there will be no rate cuts in the summer.

Key Events Ahead

There is no major event due today. Hence, market participants will be watching geopolitical developments and trade talks for fresh impetus.

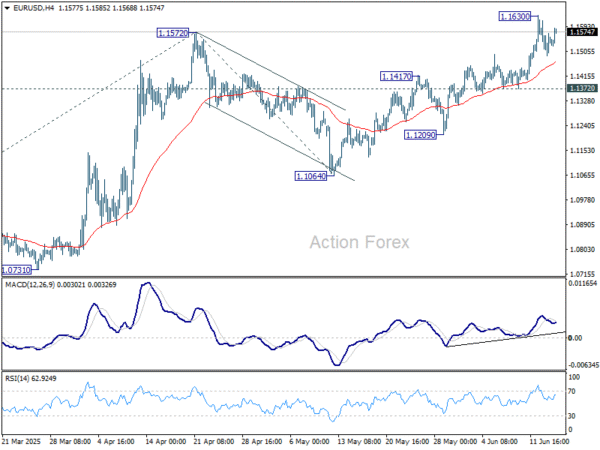
EUR/USD Technical Price Analysis: Downside Limited by 20-SMA

EUR/USD Technical Price AnalysisEUR/USD Technical Price Analysis
EUR/USD 4-hour chart

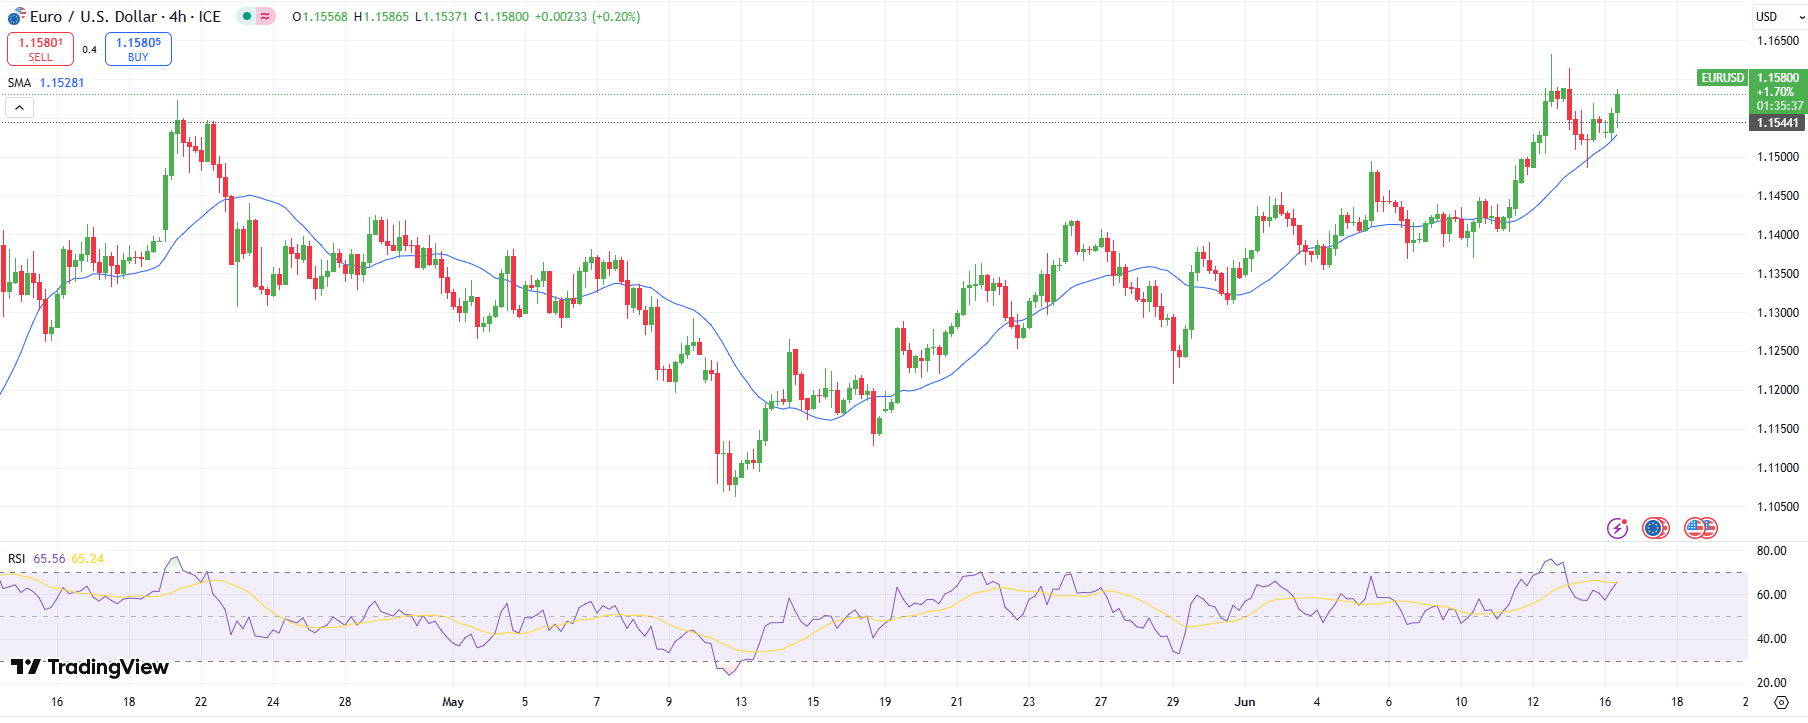
The 4-hour chart shows a stubborn support by the 20-period SMA that limits the downside potential of the pair. However, the chart also shows a bearish pinbar with a multi-year high at 1.1632. It suggests the pair has a strong resistance at the level.

-Are you looking for the best AI Trading Brokers? Check our detailed guide-

Hence, the pair is expected to play between the 20-SMA and the pinbar high. The RSI is at 65.0 for now, gradually reaching the overbought zone. So, the pair may see a retracement.

Looking to trade forex now? Invest at eToro!

67% of retail investor accounts lose money when trading CFDs with this provider. You should consider whether you can afford to take the high risk of losing your money.

Source link

Visited 1 times, 1 visit(s) today

Related Article

Bybit TradFi launches as crypto exchange adds FX and CFDs trading

Bybit TradFi launches as crypto exchange adds FX and CFDs trading

Bybit, the world’s second-largest cryptocurrency exchange by trading volume, has announced the launch of Bybit TradFi, marking what the company calls another milestone in the crypto-native platform’s evolution toward becoming a comprehensive financial destination that serves all customer needs. Bybit TradFi launch Through Bybit TradFi the major crypto exchange will be offering trading access to

Retirement Accounts Are Secret Weapon for New Stock Market Records: GS

Retirement Accounts Are Secret Weapon for New Stock Market Records: GS

For US households, there’s still no alternative to the stock market. The TINA trade in stocks — which stands for There Is No Alternative — was thought to be waning in recent years as rising interest rates since 2022 boosted bond yields for the first time in years, giving investors another option to lock in

EUR/USD Mid-Day Outlook - Action Forex

EUR/USD Mid-Day Outlook – Action Forex

Daily Pivots: (S1) 1.1491; (P) 1.1552; (R1) 1.1616; More… Intraday bias in EUR/USD remains neutral and more consolidations could be seen below 1.1630 temporary top. Further rise is expected as long as 1.1372 support holds. Break of 1.1572 will extend the rally from 1.0176. Next target is 61.8% projection of 1.0176

Oil price falls back as flow of crude through Strait of Hormuz unaffected

Oil price falls back as flow of crude through Strait of Hormuz unaffected

Unlock the Editor’s Digest for free Roula Khalaf, Editor of the FT, selects her favourite stories in this weekly newsletter. Oil markets have shrugged off Israel’s threat to topple the Iranian regime, with crude exports from the Middle East so far unaffected by the escalating conflict. Financial Times analysis of ship-tracking data shows there has

China releases three US citizens in rare prisoner swap

European stock markets opened higher despite escalating Israel-Iran conflict

ADVERTISEMENT Israel’s attack on Iranian nuclear and military targets caused the price of oil to surge more than 7% on Friday since Tehran is one of the world’s major producers of oil, despite sanctions by Western countries limiting its sales. A wider war could slow the flow of Iranian oil to its customers and keep

OnePrime Appoints Katalina Pantea as Head of Compliance

OnePrime Appoints Katalina Pantea as Head of Compliance

By DailyForex Press Release Created on June 16, 2025 Sydney, Australia – June 12, 2025 – OnePrime, a brand operated within the OneRoyal Group by Royal Financial Trading Pty Ltd, is pleased to announce the appointment of Katalina Pantea as its new Head of Compliance. With over two decades of experience in regulatory compliance, anti-money

America will enter a war in the Middle East if a single U.S. base is hit, analyst warns

Markets could be underpricing risks of Israel-Iran conflict

Fire and smoke rise into the sky after an Israeli attack on the Shahran oil depot on June 15, 2025 in Tehran, Iran. Getty Images | Getty Images News | Getty Images Global investors may be underpricing the impact of a conflict between Israel and Iran, market watchers warned on Monday, as stocks rallied despite escalating warfare

BTC/USD Signal Today 16/06: Bounces from 50-Day EMA (Chart)

Bounces from 50-Day EMA (Chart)

Potential signal: At this point, I am willing to buy Bitcoin, but I also recognize that you will have to pay close attention to the 50 Day EMA. That could be your stop loss. I would be aiming for the $110,000 level to take profit, and then I would move my stop loss to break

0
Would love your thoughts, please comment.x
()
x