EUR/USD Forex Signal Today 11/08: Brief Pullback (Chart)

Bearish view

  • Sell the EUR/USD pair and set a take-profit at 1.1550.
  • Add a stop-loss at 1.1750.
  • Timeline: 1-2 days.

Bullish view

  • Buy the EUR/USD pair and set a take-profit at 1.1750.
  • Add a stop-loss at 1.1550.

EUR/USD Forex Signal Today 11/08: Brief Pullback (Chart)

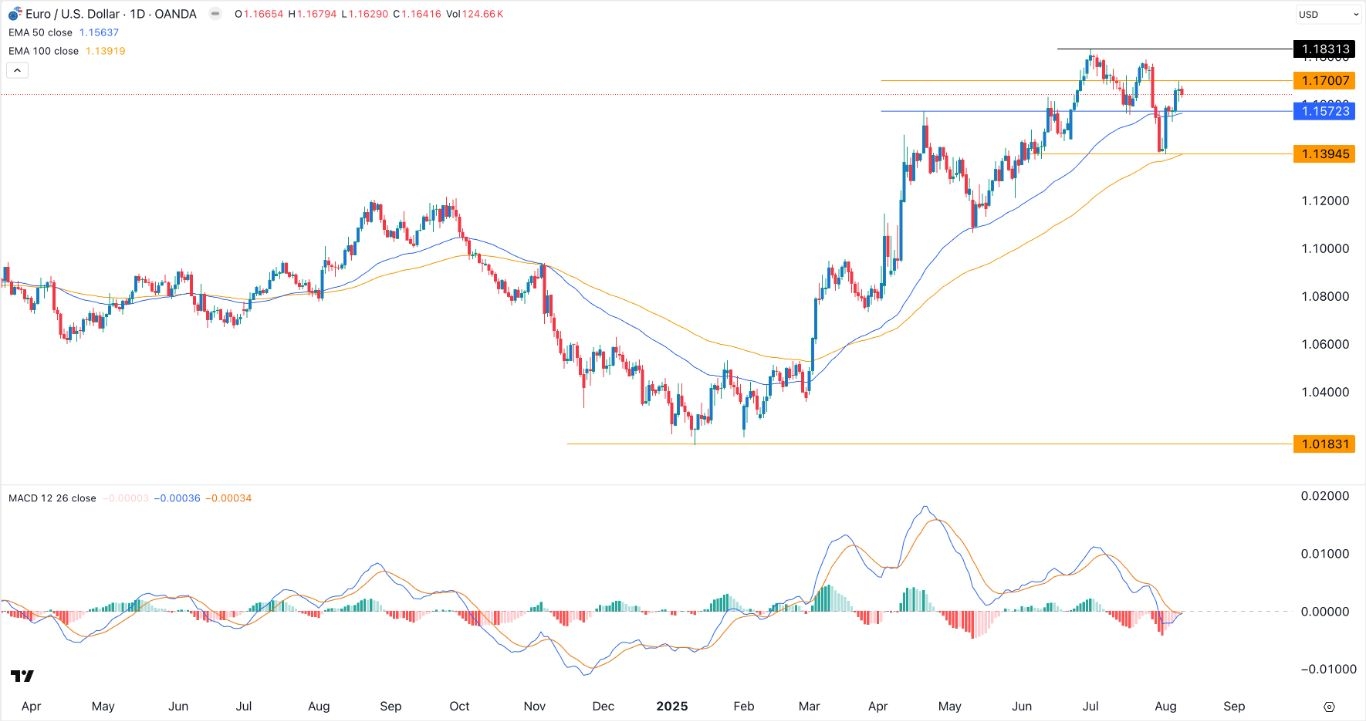
The EUR/USD pair remained on edge as traders waited for the upcoming US inflation data and as the odds of a Federal Reserve interest rate cut rose. It was trading at 1.1640 on Monday morning, up by 2.15% from the month-to-date low of 1.1395.

US Inflation and Federal Reserve Cut Hopes

The EUR/USD exchange rate wavered as market participants focused on the key US inflation report on Tuesday. This report will provide more information on whether Donald Trump’s tariffs are having an impact on inflation.

Economists expect the data to show that inflation continued to rise gradually in July. The main view is that the CPI rose from 2.7% in June to 2.8% in July. Core inflation is expected to move from 2.9% in June to 3.0%.

Analysts believe that inflation will continue to rise gradually now that Trump has confirmed tariffs on top countries. For example, Trump implemented a 50% tariff on all goods from India, a country that exports goods worth over $81 billion to the US.

These inflation numbers follow the US’s publication of weak jobs numbers. The data showed that the economy created just 73,000 jobs in July, a figure that will likely be revised downwards. This report also showed that the US created an average of 35,000 jobs in May and June.

Therefore, a jump in inflation will complicate the Federal Reserve’s outlook for interest cuts. Most analysts expect the bank to deliver the first cut of the year in September, as some Fed officials, such as Christopher Waller and Michele Bowman, have hinted.

There will be no major macro data from Europe in the next few days. The only one to watch will be the Italian consumer inflation. The data is expected to show that inflation remained at 1.7% in July.

EUR/USD Technical Analysis

The EUR/USD exchange rate rebounded after hitting a low of 1.1395 on August 1. It jumped to a high of 1.1700 last week as hopes of Federal Reserve interest rate cuts rose.

The pair has moved above the key resistance at 1.1572, the highest swing in April this year. It has moved above the 50-day and 100-day Exponential Moving Averages (EMA), while the MACD is stuck at the zero line.

The EUR/USD has formed a small doji candlestick pattern, pointing to a reversal to 1.1500. A move above the upper side of the doji at 1.1700 will point to more gains.

Ready to trade our daily Forex signal? Check out the best forex brokers in Europe worth using.

Crispus Nyaga is a financial analyst, coach, and trader with more than 8 years in the industry. He has worked for leading companies like ATFX, easyMarkets, and OctaFx. Further, he has published widely in platforms like SeekingAlpha, Investing Cube, Capital.com, and Invezz. In his free time, he likes watching golf and spending time with his wife and child.

Source link

Visited 1 times, 1 visit(s) today

Related Article

Nvidia pushes back on accusations its H20 chips pose a national security risk in China

Trump Nvidia, AMD China chip revenue deal implications

Nvidia and AMD have agreed to share some of their revenue from sales to China with the U.S. government, according to several reports, sparking debate about whether the move could impact the chip giants’ business and whether Washington might seek out similar deals. In exchange for 15% of revenues from the chip sales, the two

Nvidia Forex Signal 11/8: Threatens Another Breakout (Chart)

Nvidia Forex Signal 11/8: Threatens Another Breakout (Chart)

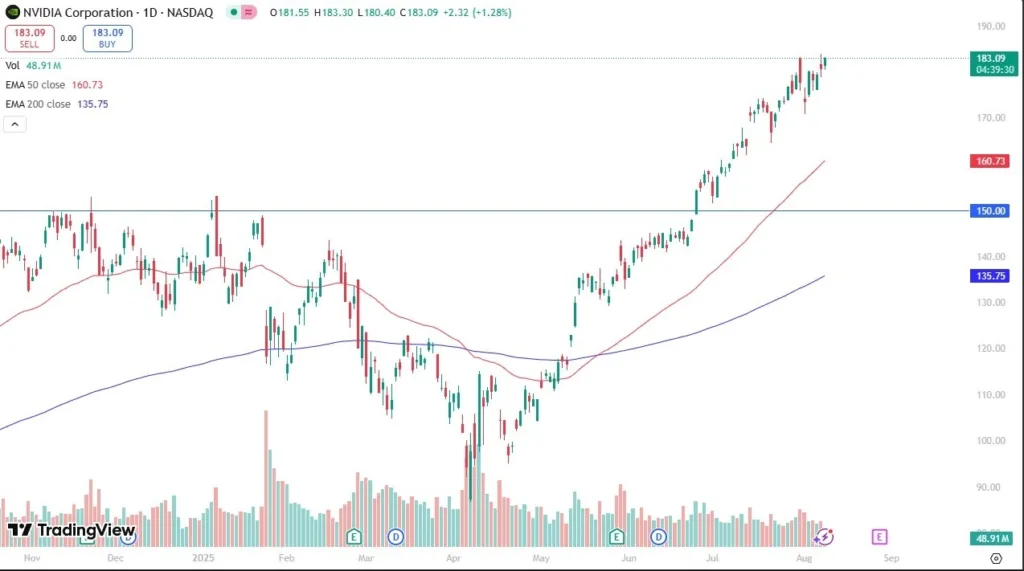
Created on August 11, 2025 Potential signal: If NVDA breaks above the $185 level, I’d be aiming for the $197 level. Stop loss at the $175 level. During the trading session on Friday, we have seen Nvidia rally again, as it looks like we are trying to break above the shooting star that formed on

USD/MXN Analysis 11/08: Mid-Term Low Challenged (chart)

USD/MXN Analysis 11/08: Mid-Term Low Challenged (chart)

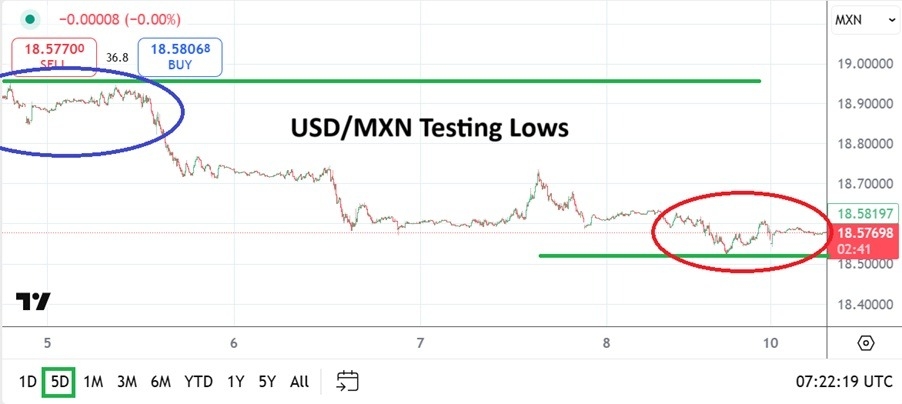
Created on August 11, 2025 The USD/MXN continues to show a tendency to trend downwards and is near the 18.59800 ratio as of this writing with fast changes in values, this after going into the weekend with its low for the week and within sight of important support levels. After the USD/MXN traversed higher in

USD/JPY technical outlook

USD/JPY Outlook: Caution Builds as US CPI Report Looms

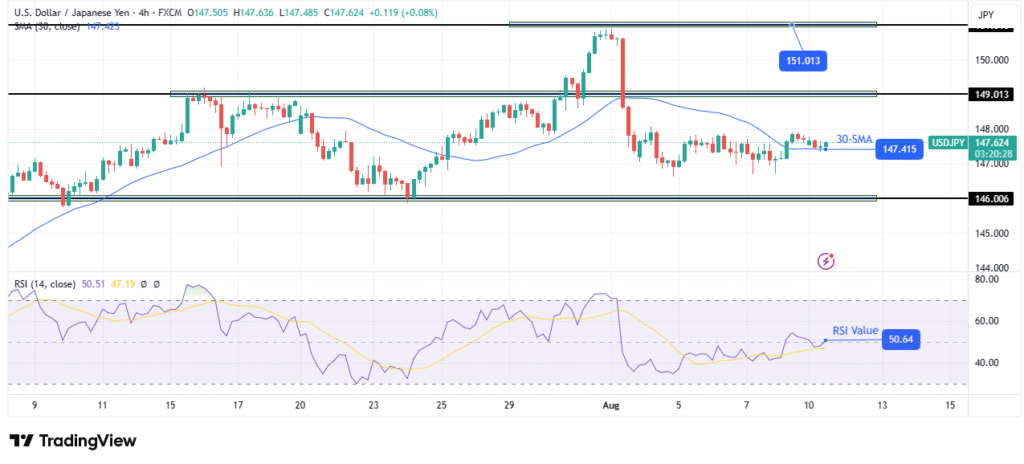
The USD/JPY outlook shows some indecision in the market ahead of the US CPI. Economists are forecasting a US headline figure of 2.8%. Trade tensions between China and the US might increase. The USD/JPY outlook shows some indecision in the market as traders look forward to crucial US inflation figures. Meanwhile, the uncertainty surrounding the

AUD/USD technical forecast

AUD/USD Forecast: Traders Await RBA Meeting, US CPI

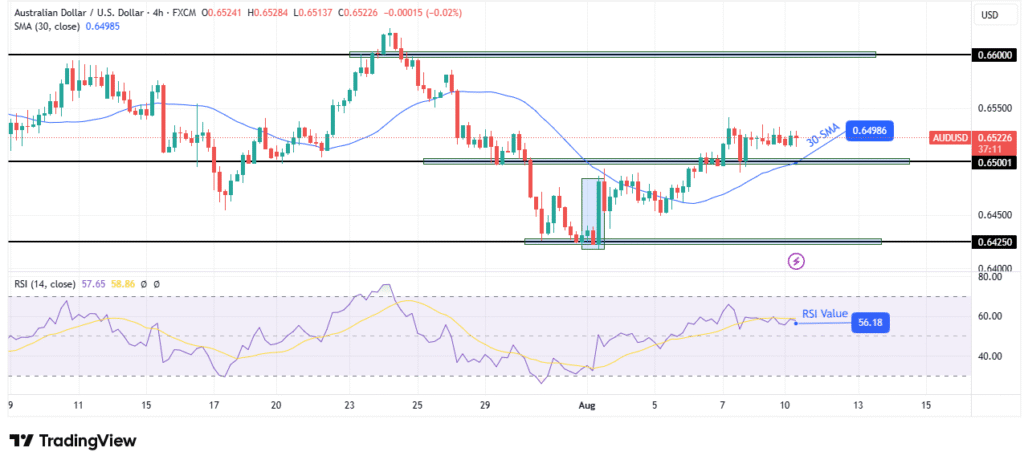
The AUD/USD forecast indicates caution at the start of the week. Economists believe RBA officials will cut rates by 25-bps. US headline inflation might accelerate from 2.7% to 2.8%. The AUD/USD forecast indicates caution at the start of the week as market participants gear up for the RBA meeting and crucial US inflation numbers. At

NZD/USD Forecast: Struggles at 50-Day EMA (graph)

Struggles at 50-Day EMA (Video)

Created on August 11, 2025 The New Zealand dollar initially did try to rally during the trading session here on Friday, as we are testing the crucial 50 day EMA. The 50 day EMA of course attracts a lot of attention in and of itself. I think that might be causing some of this sell

Jenny McCall

Dow, S&P 500, Nasdaq futures steady with Wall Street looking for more records

Stock futures were steady on Monday, with Wall Street aiming for more record highs, but traders are growing cautious about whether a President Trump and Russia’s Vladimir Putin summit will ease the war in Ukraine. Dow Jones Industrial Average futures (YM=F) rose 0.2%, while futures tied to the S&P 500 (ES=F) and those on the