EUR/USD Forex Signal 21/08: Strong Bullish Breakout (Chart)

Bullish view

  • Buy the EUR/USD pair and set a take-profit at 1.1750.
  • Add a stop-loss at 1.1550.
  • Timeline: 1-2 days

Bearish view

  • Sell the EUR/USD pair and set a take-profit at 1.1550.
  • Add a stop-loss at 1.1750

EUR/USD Forex Signal 21/08: Strong Bullish Breakout (Chart)

The EUR/USD pair was flat on Thursday, continuing a consolidation that has been going on in the past few days. It was trading at 1.1670, as market participants focused on the upcoming Jackson Hole Symposium.

FOMC Minutes and Jackson Hole Symposium

The EUR/USD exchange rate was stuck in a tight range after Christine Lagarde warned about the impact of tariffs on the European economy.

She maintained that the deal between the US and the EU was in line with the bank’s baseline and predicted that the economy would be affected.

Her statement came on the same day that Eurostat published the final reading of the July consumer inflation data. The data showed that the headline Consumer Price Index remained at 2% in July, while the core CPI remained at 2.3%.

These numbers mean that the bank has prevailed in its battle against inflation, partly helped by the strong euro, which has jumped by over 14% from the lowest level this year. Analysts expect just one cut this year

The EUR/USD exchange rate wavered after the Federal Reserve published minutes of the last monetary policy meeting in which officials left interest rates unchanged between 4.25% and 4.50%.

These minutes showed that officials remained concerned about inflation in the country as the impact of tariffs on the economy continued to spread. There is a likelihood that these officials will also focus on the labor market in the next meeting after the recent weak nonfarm payroll data

The next important catalysts for the EUR/USD exchange rate will be the flash manufacturing and services PMI numbers from the US and the European Union. These numbers will provide more information about the economy after the recent EU-US trade deal.

The EUR/USD pair will also react mildly to the upcoming US initial and continuing jobless claims numbers, existing home sales, and the Philadelphia Fed manufacturing index data. These numbers will come a day before Jerome Powell talks at the Jackson Hole Symposium.

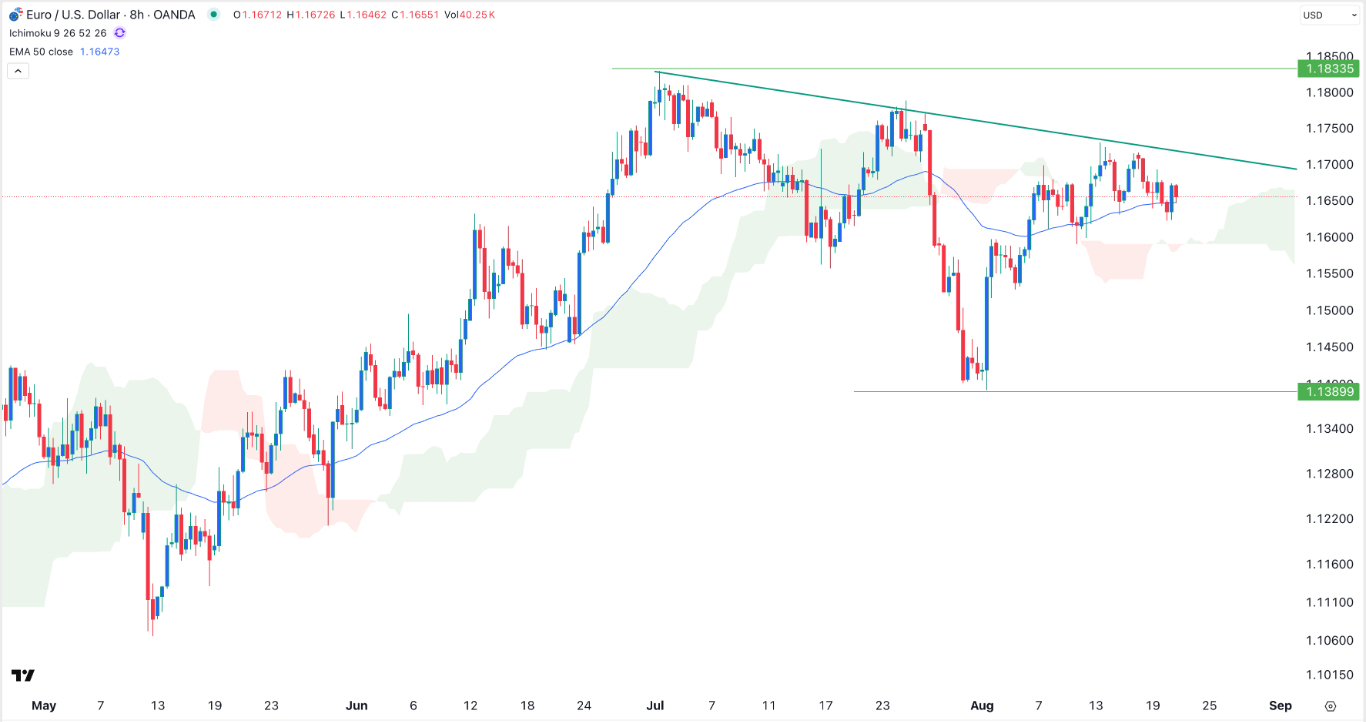
EUR/USD Technical Analysis

The EUR/USD exchange rate remained in a tight range this week as focus remained on the upcoming Jerome Powell’s speech.

It remains below the important support, which connects the highest swings since July, forming the neckline of the inverse head-and-shoulders pattern, a popular bullish reversal sign.

The pair remains above the Ichimoku Kinko Hyo cloud and the 50-period Exponential Moving Average (EMA). Therefore, the pair will likely continue rising as bulls target the year-to-date high of 1.1835. A drop below the support at 1.1550 will cancel the bullish outlook.

Ready to trade our free Forex signals? Here are the top brokers in Europe to choose from.

Crispus Nyaga is a financial analyst, coach, and trader with more than 8 years in the industry. He has worked for leading companies like ATFX, easyMarkets, and OctaFx. Further, he has published widely in platforms like SeekingAlpha, Investing Cube, Capital.com, and Invezz. In his free time, he likes watching golf and spending time with his wife and child.

Source link

Visited 1 times, 1 visit(s) today

Related Article

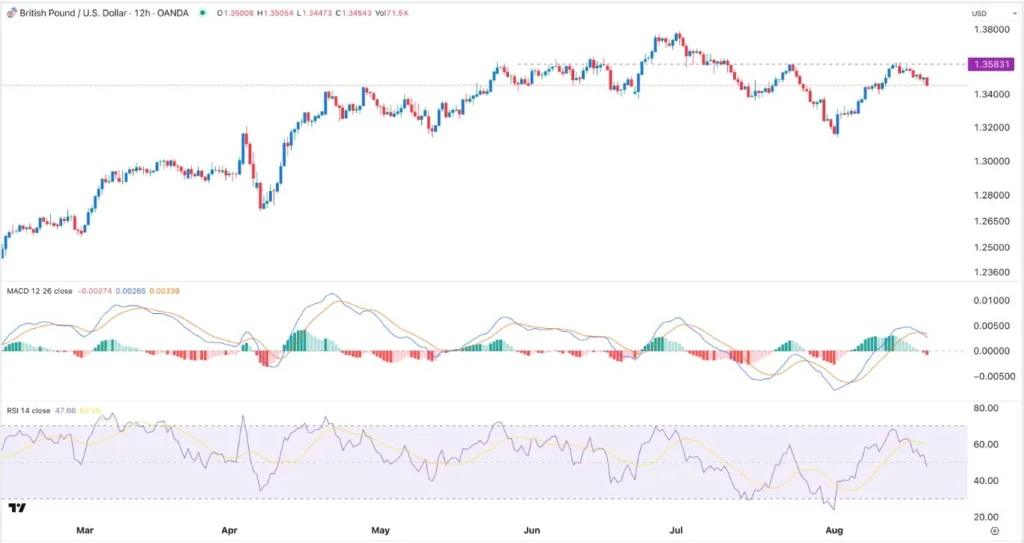
GBP/USD Forex Signal: Bearish Pressure Builds (Chart)

GBP/USD Forex Signal: Bearish Pressure Builds (Chart)

Created on August 21, 2025 Bearish view Sell the GBP/USD pair and set a take-profit at 1.3350. Add a stop-loss at 1.3585. Timeline: 1-2 days. Bullish view Buy the GBP/USD pair and set a take-profit at 1.3585. Set a take-profit at 1.3350. The GBP/USD exchange rate pulled back for three consecutive days, even as the

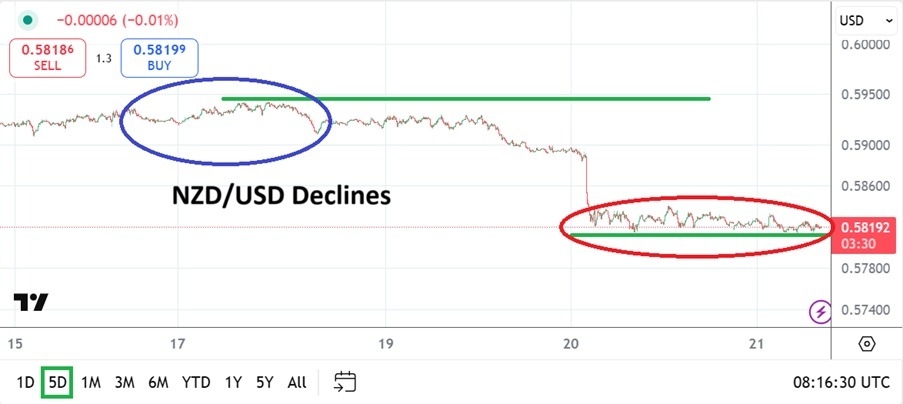
NZD/USD Analysis Today 21/08: Bears in Control (Chart)

NZD/USD Analysis Today 21/08: Bears in Control (Chart)

Created on August 21, 2025 Price velocity downwards was sparked in the NZD on late Tuesday, and lows have been demonstrated the past day as the 0.58190 vicinity continues to be tested. The NZD/USD has shown a tendency to display bearish behavior the past couple of months. The selling action has not been a stable

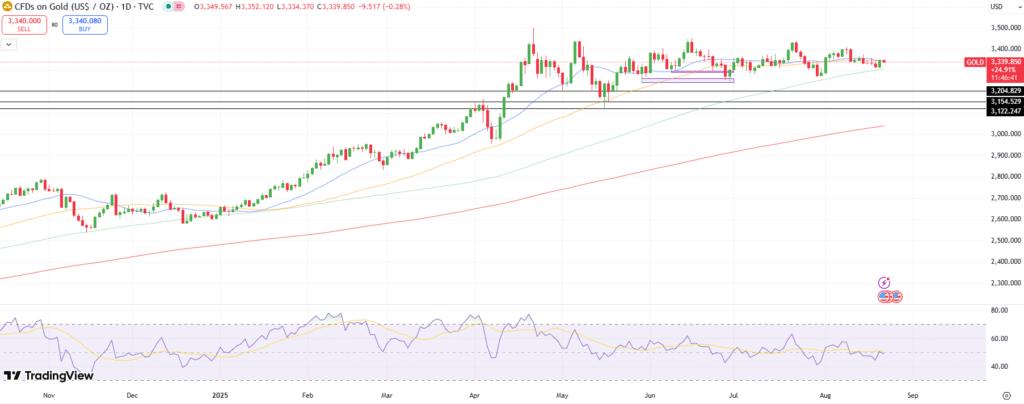
Gold price technical analysis

Gold Price Holds Weak Tone Amid Fed, Geopolitical Risk

Gold price stays subdued with limited downside. Fed policy signals weighed on the gold as bets for aggressive easing faded. Markets now eye the Fed Chair speech and the Jackson Hole Symposium. Gold price stays under pressure in the early European session on Thursday with limited downside, as investors weigh Fed policy signals against persistent

EUR/GBP Weekly Outlook - Action Forex

NZD/USD Holds Near Four-Month Low

As today’s NZD/USD chart shows, the pair is trading near a four-month low following a sharp decline. The drop occurred yesterday after the Reserve Bank of New Zealand cut the official cash rate by 25 basis points to a three-year low of 3.0% and indicated that the rate could fall further to 2.55% by May

ForexIGO Coordinates Gold and GBP/USD in One Ruleset

ForexIGO Coordinates Gold and GBP/USD in One Ruleset

By DailyForex Press Release Created on August 21, 2025 MT4 Expert Advisor for XAUUSD and GBPUSD on M30; pattern-led entries confirmed by trend and momentum, with demo available. Quick View Limassol, Cyprus – August 2025 – ForexIGO unifies gold (XAUUSD) and GBPUSD within a single, structured approach on MetaTrader 4. It detects actionable patterns, validates

A stock price chart shown in red.

The Stock Market Has a Serious Problem (Besides President Trump’s Tariffs). History Says This Will Happen Next.

President Trump’s tariffs have tipped the economy toward stagflation, but investors have another serious problem in the stock market’s elevated valuation. U.S. stocks have been unusually volatile this year. The benchmark S&P 500 (^GSPC -0.24%) dropped more than 10% in two days in early April after President Trump outlined sweeping “Liberation Day” tariffs. Those rapid

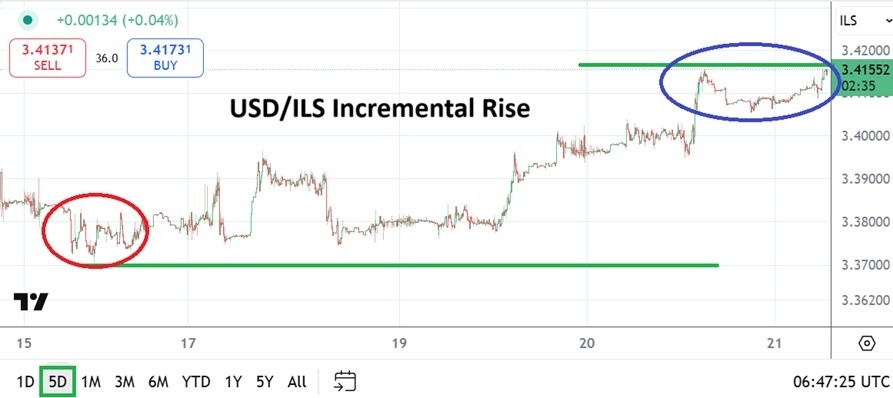
USD/ILS Analysis 21/08: Climb Up Develops (Chart)

USD/ILS Analysis 21/08: Climb Up Develops (Chart)

Created on August 21, 2025 The USD/ILS is near 3.41600 as of this writing as relatively fast bids and asks are being displayed with a wide spread, which makes it rather dangerous for day traders to pursue the currency pair. The USD/ILS has incrementally climbed the past week, having waved goodbye to lows around 3.37550,