EUR/USD Forecast: Mild Pullback to 1.16 After Ceasefire Rally

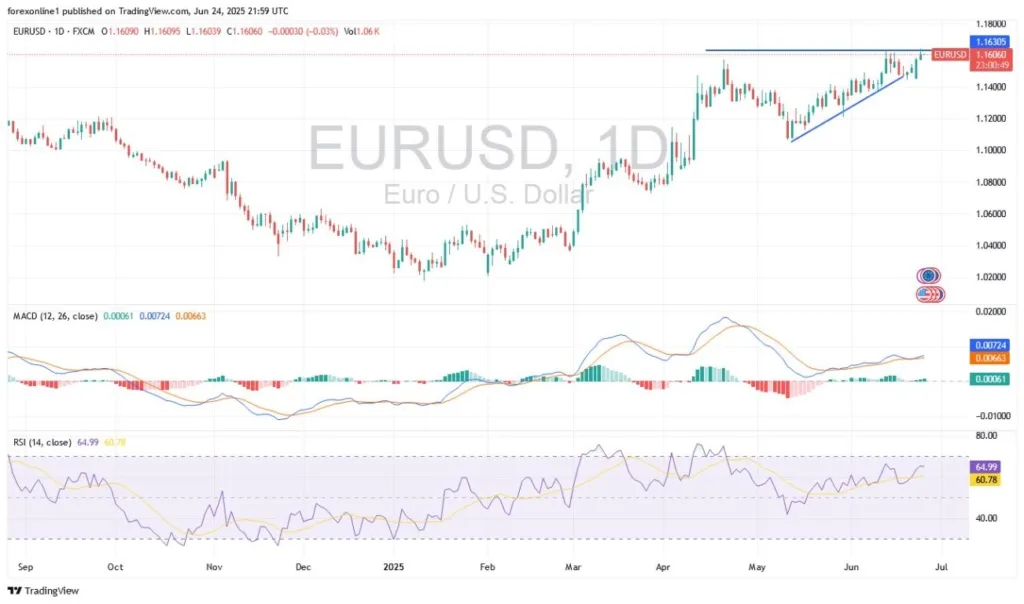
  • The EUR/USD forecast is strongly bullish despite a mild pullback from YTD highs.
  • A weaker dollar amid dovish Fed expectations keeps the Euro bullish.
  • Markets are eyeing US Q1 GDP and US Core PCE Index data for further impetus.

The EUR/USD price is trading slightly lower on Wednesday during the early New York session, after posting a two-day rally to fresh YTD highs. Despite the pullback, the pair remains close to the highest level since November 2021, supported by global risk sentiment, weaker oil prices, and the US dollar.

Are you interested in learning more about the next cryptocurrency to explode? Check our detailed guide- 

The ceasefire between Iran and Israel, announced by President Trump, sparked broader optimism across financial markets. As a result, the safe-haven demand for the dollar lost traction. Although both sides are at peace, the stability is still too fragile. Both sides can resume hostilities if provoked. However, the markets have so far welcomed the de-escalation, favoring riskier assets, such as the Euro.

The subdued dollar boosts the Euro. The Dollar Index remains depressed around mid-97.00, close to a three-year low, as it is pressured by dovish Fed expectations. Although the Fed Chair Jerome Powell maintained a cautious stance in his testimony before Congress on Tuesday, the markets are still expecting a 50 bps cut by the end of 2025.

On the European side, macroeconomic data is steady but not strong enough to drive markets. French Consumer Confidence remained unchanged at 88.0, while Spain’s Q1 GDP confirmed a growth of 0.6% q/q and 2.8% y/y.

The US Consumer Confidence Index fell from 98.4 to 93.0, revealing concerns for jobs and economic growth. As markets digest Powell’s second round of testimony today, the upcoming US data, including Q1 GDP and the Core PCE Index, are key to watch.

EUR/USD Technical Forecast: Buyers Aiming for 1.1700

EUR/USD Technical ForecastEUR/USD Technical Forecast
EUR/USD 4-hour chart

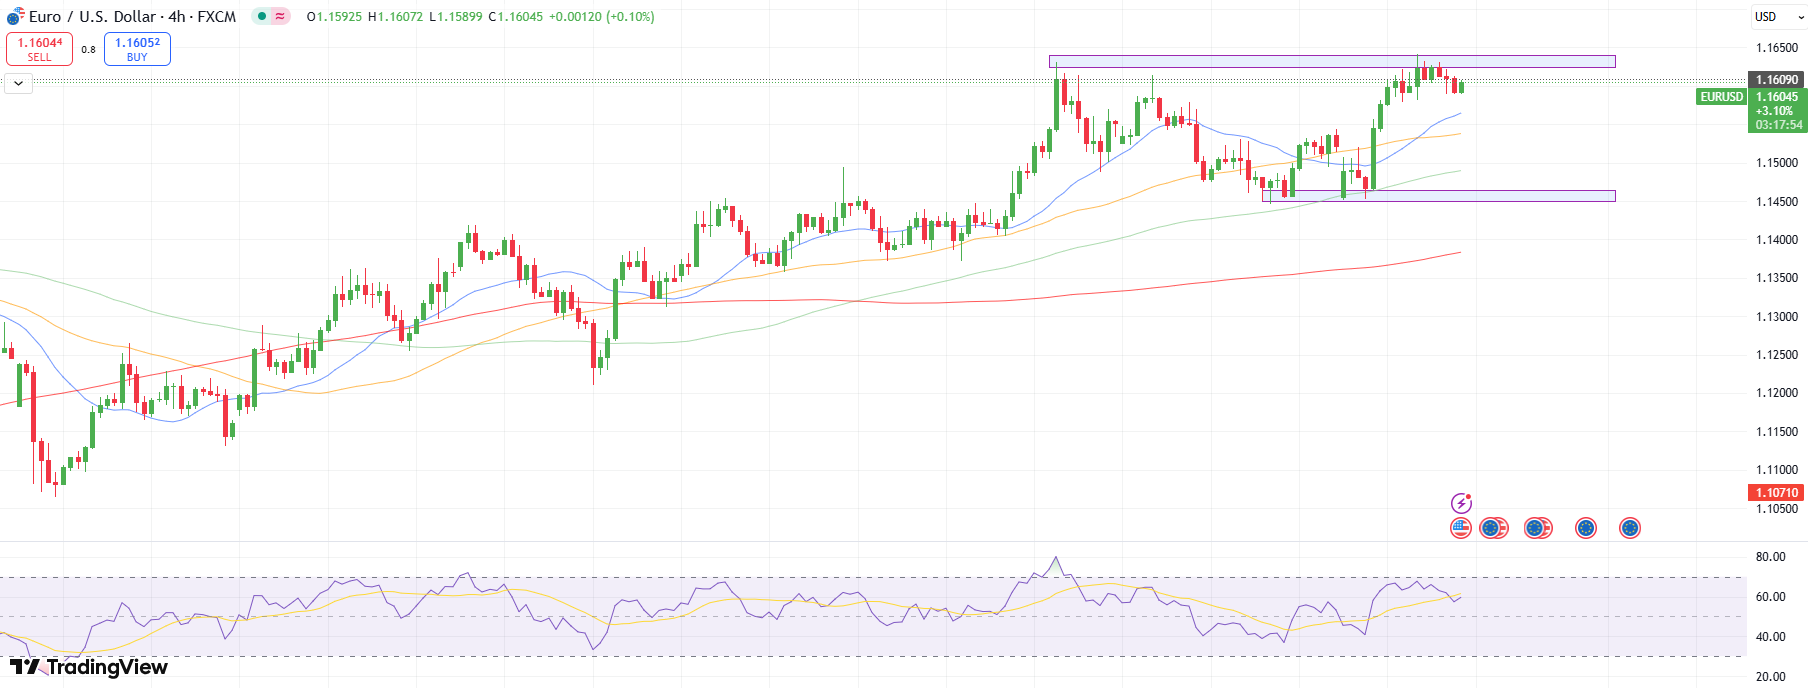
The EUR/USD 4-hour chart displays a consolidating pattern near the multi-month high. The uptrend is intact as the price stays well above the 20-period SMA. Moreover, the bullish crossover of the 20-SMA and 50-SMA also presents room for upside. The RSI is also off the overbought zone but above 50.0 and sloping upwards.

Are you interested in learning more about forex indicators? Check our detailed guide-

Overall, the pair is now trading within a broad range of 1.1450 to 1.1650. The price is expected to remain within these two levels unless a catalyst emerges to push it further higher towards the 1.1700 mark. The path of least resistance lies on the upside.

Looking to trade forex now? Invest at eToro!

68% of retail investor accounts lose money when trading CFDs with this provider. You should consider whether you can afford to take the high risk of losing your money.

Source link

Visited 1 times, 1 visit(s) today

Related Article

Photo used for representation purpose only.

Rupee rises 21 paise to 85.87 against U.S. dollar in early trade

Photo used for representation purpose only. | Photo Credit: Reuters The rupee gained 21 paise to 85.87 against the U.S. dollar in early trade on Thursday (June 26, 2025), mainly due to a weakened greenback in the global markets. However, a rise in global crude oil prices and FII outflows prevented sharp gains in the

Nvidia stock notches fresh record high in remarkable 2025 turnaround

Nvidia (NVDA) shares rose more than 4% Wednesday to notch a new record high of $154.31, completing a remarkable turnaround from earlier this year. Nvidia shares previously hit a record close of $149.43 on Jan. 6. The stock’s gain also saw shares reach a fresh intraday high during Wednesday’s trading session. The AI chipmaker’s stock

The stock market closed off for the holiday with a mixed result.

Wall Street Ends Mixed After Powell’s Comments; Nvidia Leads Gains

Among individual performers, Nvidia stood out once again. The AI chipmaker rose 4.33%, becoming the top gainer within the Dow Jones. Written by: Ignacio Teson • Thursday, June 26, 2025 • 1 min read • Last updated: Thursday, June 26, 2025 Add an article to your Reading List Register now to be able to add

USD/ILS Analysis Today 25/06: Lower Values (Chart)

USD/ILS Analysis Today 25/06: Lower Values (Chart)

The USD/ILS is near 3.41175 and continues to traverse lower realms, and has built up bearish power since late Monday upon the announcement of a ceasefire with Iran and its implementation on Tuesday. The USD/ILS as of this writing is near the 3.41175 mark depending on the bid and ask. The currency pair has continued

Why BlackRock’s Rick Rieder is confident in equities in second half

Rick Rieder, BlackRock senior managing director, chief investment officer of Global Fixed Income, speaking at the Delivering Alpha conference in New York City on Sept. 28, 2023. Adam Jeffery | CNBC CHICAGO — BlackRock’s Rick Rieder is confident a stock market nearing all-time highs can go even higher in the second half of 2025, as

‘Much Too Much,’ Says Top Investor About Palantir Stock

‘Much Too Much,’ Says Top Investor About Palantir Stock

The rapid ascent of Palantir Technologies (NASDAQ:PLTR) to the top of the stock market zeitgeist shows no signs of slowing down. The AI data analytics company has been on a spree of turbocharged growth, and its share price is up some 450% for the past twelve months. Confident Investing Starts Here: The company has clearly

EUR/USD Analysis Today 26/6: Will Euro Rise Further? (Chart)

Will Euro Rise Further? (Chart)

EUR/USD Analysis Summary Today Overall Trend: Bullish. Today’s EUR/USD Support Levels: 1.1542 – 1.1470 – 1.1390. Today’s EUR/USD Resistance Levels: 1.1680 – 1.1730 – 1.1800. EUR/USD Trading Signals: Buy EUR/USD from the support level of 1.1490 with a target of 1.1720 and a stop-loss at 1.1400. Sell EUR/USD from the resistance level of 1.1680 with

0
Would love your thoughts, please comment.x
()
x