EUR/USD Forecast: Dollar Rebounds on Strong Jobs Data

  • The EUR/USD forecast indicates a rebound in the dollar after upbeat employment figures.
  • Job vacancies in the US exceeded the estimated number.
  • Powell did not rule out the possibility of a rate cut at the next meeting.

The EUR/USD forecast indicates a rebound in the dollar after upbeat employment figures in the previous session. However, a growing policy divergence between the Fed and the ECB has kept the pair bullish. The Fed is becoming increasingly dovish and is more inclined to cut interest rates. On the other hand, the ECB seems comfortable with pausing. 

–Are you interested in learning more about MT5 brokers? Check our detailed guide-

Data released on Tuesday revealed that job vacancies in the US exceeded the estimated number. The JOLTS job openings rose to 7.77 million, compared to the forecast of a drop to 7.32 million. More vacancies are a sign that demand for labor is strong. The report eased worries of a rapid slowdown in the labor market. However, market participants are more eager to see the results of the nonfarm payrolls report for more clues on Fed policy. 

Meanwhile, recent speeches from Powell have revealed a more dovish tone. On Tuesday, the Fed Chair did not rule out the possibility of a rate cut at the next meeting. The slowdown in the economy has gradually increased pressure on the central bank to cut interest rates. 

On the other hand, ECB’s Madis Muller said on Tuesday that the central bank can afford to pause for now. Inflation in the Eurozone has reached the 2% target, and growth is rebounding.

EUR/USD key events today

  • ADP Non-Farm Employment Change

EUR/USD technical forecast: RSI divergence signals likely pullback

EUR/USD technical forecastEUR/USD technical forecast
EUR/USD 4-hour chart

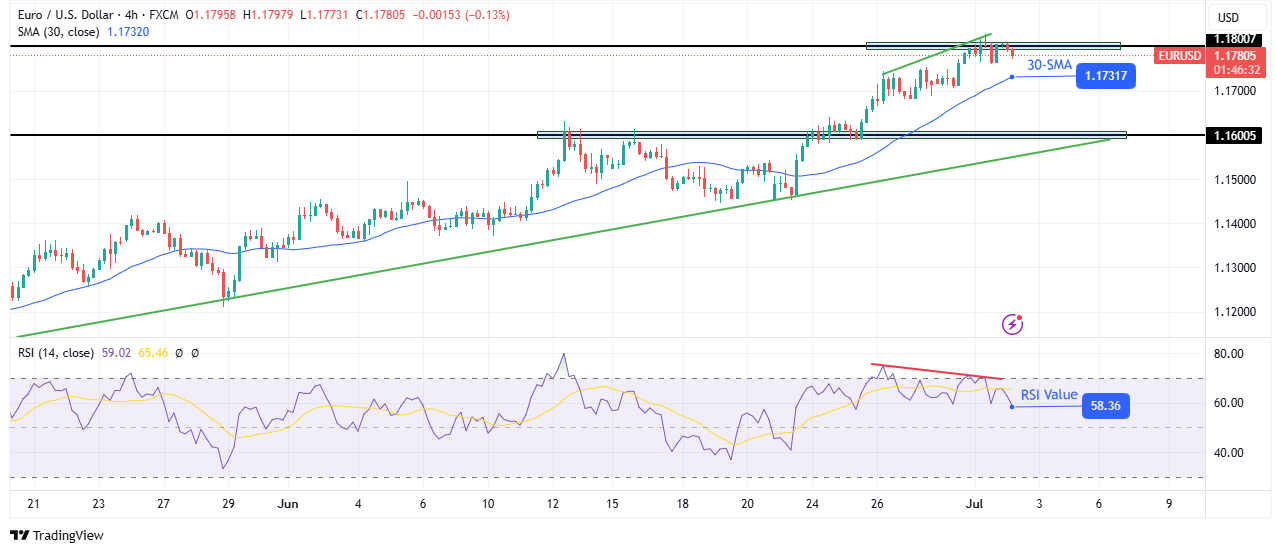
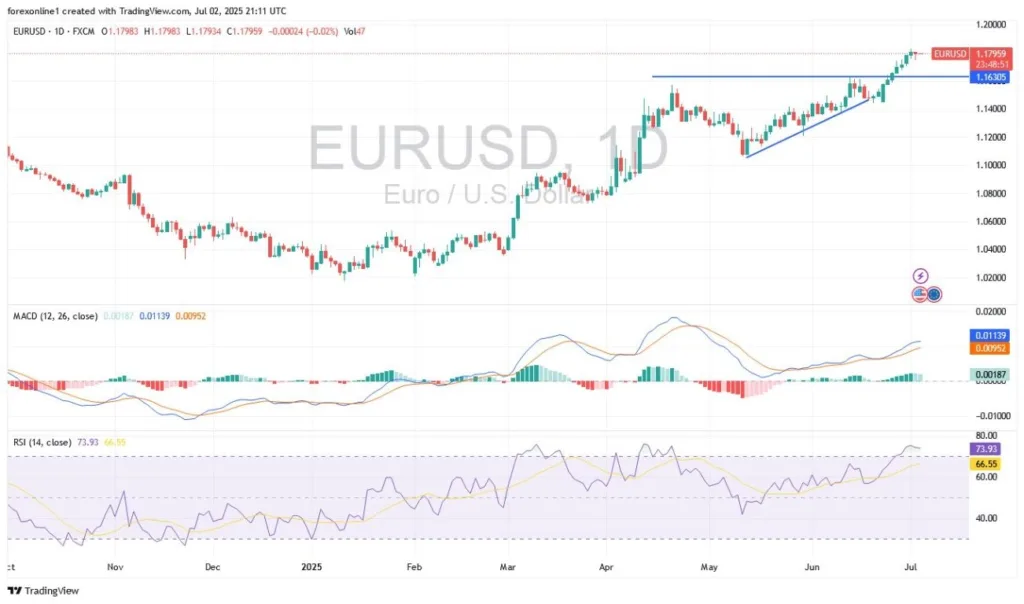
On the technical side, the EUR/USD price has paused near the 1.1800 key psychological level after making new highs in the bullish trend. The price trades above the 30-SMA, and the RSI is above 50, suggesting a bullish bias. 

–Are you interested in learning more about forex signals telegram groups? Check our detailed guide-

The price has maintained a bullish trajectory, making higher highs and lows despite chopping through the 30-SMA. Nevertheless, the price has remained above a bullish trendline. The most recent swing came from the trendline, broke above the 1.1600 key level, and reached the 1.1800 resistance. 

However, at the new high, the price has shown some weakness. The RSI has made a bearish divergence. If this plays out, the price will likely drop below the 30-SMA to retest the 1.1600 level or the bullish trendline. Otherwise, bulls will break above 1.1800 to make new highs.

Looking to trade forex now? Invest at eToro!

68% of retail investor accounts lose money when trading CFDs with this provider. You should consider whether you can afford to take the high risk of losing your money.

Source link

Visited 1 times, 1 visit(s) today

Related Article

Investor fright over Reeves’ tears shows fragility of UK finances

Investor fright over Reeves’ tears shows fragility of UK finances

This week’s sell-off in UK gilts, sparked by a tearful Rachel Reeves in the House of Commons, showed how fragile investor confidence is in Britain’s precarious fiscal position.  The merest suggestion that the chancellor may leave her job, caused by Sir Keir Starmer’s initial failure to fully back her on Wednesday, was enough to spook

Nonfarm payrolls rise 147,000 in the month

Jobs report June 2025

Job growth proved better than expected in June, boosted by government hiring, as the labor market showed surprising resilience and likely took a July interest rate cut off the table. Nonfarm payrolls increased a seasonally adjusted 147,000 for the month, higher than the estimate for 110,000 and just above the upwardly revised 144,000 in May,

What’s closed for July 4 holiday, from Publix to post offices

Independence Day is almost here, and as you stock up on supplies or run errands, it is good to know what will be open, including the extended four-day weekend granted to state workers in Florida. In a June 23 news release, Gov. Ron DeSantis announced that state offices will be closed on Thursday, July 3,

EUR/USD Analysis 03/07: Bullish Stability Continues (Chart)

EUR/USD Analysis 03/07: Bullish Stability Continues (Chart)

EUR/USD Analysis Summary Today Overall Trend: Bullish. Today’s EUR/USD Support Levels: 1.1740 – 1.1680 – 1.1590. Today’s EUR/USD Resistance Levels: 1.1820 – 1.1880 – 1.2000. EUR/USD Trading Signals: Buy EUR/USD from the support level of 1.1630 with a target of 1.1820 and a stop-loss at 1.1560. Sell EUR/USD from the resistance level of 1.1840 with

Gold Analysis 03/07: Weakness Continues to Support Gold (graph)

Gold Analysis 03/07: Weakness Supports Gold (Chart)

Today’s Gold Analysis Overview: The overall Gold Trend: Bullish. Today’s Gold Support Levels: $3328 – $3280 – $3220 per ounce. Today’s Gold Resistance Levels: $3372 – $3390 – $3420 per ounce. Today’s gold trading signals update: Sell Gold from the resistance level of $3393 with a target of $3300 and a stop-loss at $3420. Buy

USD/JPY technical forecast

USD/JPY Forecast: Dollar Rebounds after US-Vietnam Trade Deal

The USD/JPY forecast shows a rebound as the dollar gains on trade optimism. The US economy lost 33,000 private jobs in June. Economists expect 120,000 new US jobs, a slowdown from the previous month. The USD/JPY forecast shows a rebound as the dollar gains on trade optimism. However, downbeat employment figures in the previous session

A roadside currency exchange vendor counts notes in New Delhi. File

Rupee falls 8 paise to 85.70 against U.S. dollar in early trade

A roadside currency exchange vendor counts notes in New Delhi. File | Photo Credit: Reuters The rupee depreciated 8 paise to 85.70 against the U.S. dollar in early trade on Thursday (July 3, 2025) amid renewed headwinds from global risk sentiment and persistent foreign fund outflows. Forex traders said the rupee was trading in a

S&P 500 Flashes Golden Cross, a Bullish Signal for More Stock Gains

S&P 500 Flashes Golden Cross, a Bullish Signal for More Stock Gains

After hitting record highs in recent days, the S&P 500 just flashed an indicator for more gains ahead. On Tuesday, the index’s 50-day moving average of 5,846.34 closed above its 200-day moving average of 5,837.96, a bullish technical pattern known as a golden cross. It’s the first time the indicator has flashed since February 2023.

0
Would love your thoughts, please comment.x
()
x