EUR/USD Forecast 11/08: Continues to Consolidate (Chart)

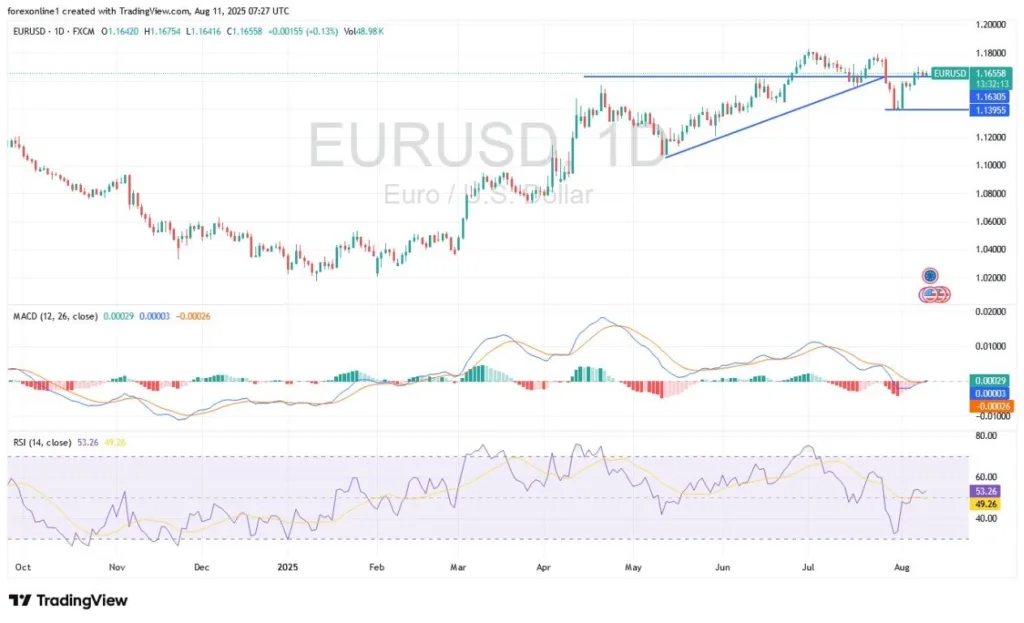
  • The euro has gone back and forth during the trading session on Friday, as we continue to hover just above the 1.16 level.
  • This is a pair that had recently formed a bit of a double top, only to plunge toward the 1.14 level.
  • The 1.14 level is a large, round, psychologically significant figure, so the fact that we bounced from there was probably not a huge surprise.

EUR/USD Forecast 11/08: Continues to Consolidate (Chart)

Now that we are above the 1.16 level, it does make a certain amount of sense that the market still seemed somewhat bullish, but we have that huge “wipeout candle” from July 28 that was in reaction to the trade negotiations between the United States and the European Union. Until we get above there, you have to wonder whether or not we are still in the process of trying to make a “lower high.”

Structure Shifting?

The question is whether or not the structure of this market is shifting overall, but I think it’s also early to make that decision. Ultimately, if we were to turn around and break down below the 50 Day EMA, I think that would spook a lot of traders out there, perhaps sending this market down to the 1.14 level again. Anything below would be a very negative sign and therefore I think you have got a situation where people will be watching for the next couple of days.

On the other hand, if we were to break above the 1.17 level, then it’s possible that we could go looking to the 1.18 level. The 1.18 level is an area that has been significant resistance multiple times, as we formed a bit of a “double top” at that level. Ultimately, this is a situation where we continue to bounce around and try to figure out where we are going from a longer-term standpoint. Ultimately, this is a market that will probably continue to be choppy, but that’s not a huge surprise considering that’s how the euro quite often behaves. With that being said, it’s probably worth noting that this is also a great proxy for with the US dollar might do against other currencies.

Ready to trade our daily Forex analysis? We’ve made a list of the best forex demo accounts worth trading with.

Christopher Lewis has been trading Forex and has over 20 years experience in financial markets. Chris has been a regular contributor to Daily Forex since the early days of the site. He writes about Forex for several online publications, including FX Empire, Investing.com, and his own site, aptly named The Trader Guy. Chris favours technical analysis methods to identify his trades and likes to trade equity indices and commodities as well as Forex. He favours a longer-term trading style, and his trades often last for days or weeks.

Source link

Visited 1 times, 1 visit(s) today

Related Article

Chart of G10 FX performances month-to-date

Data expected to lead FX action – United States

Written by the Market Insights Team Dollar down almost 2% already in August George Vessey – Lead FX & Macro Strategist The mood in financial markets has turned notably upbeat in late summer, with easing uncertainty around US trade policy and rising expectations of Federal Reserve (Fed) rate cuts supporting investor appetite for risk. The

July Inflation Report: Why CPI Could Be Bad News No Matter What

July Inflation Report: Why CPI Could Be Bad News No Matter What

A key inflation report is looming, but it’s possible that the July data paints a dismal picture of the economy whether it shows prices rose or fell. The July consumer price index report is expected to show that prices rose 0.2% last month and 2.8% year-over-year. The consensus expectations reflect a slightly hotter pace of

Gold Analysis Today 11/08: Gold Price Is Rising (Chart)

Gold Price Is Rising (Chart)

Created on August 11, 2025 Today’s Gold Analysis Overview: The overall Gold Trend: Strongly bullish. Today’s Gold Support Levels: $3,378 – $3,360 – $3,300 per ounce. Today’s Gold Resistance Levels: $3,415 – $3,440 – $3,480 per ounce. Today’s Gold Trading Signals: Sell gold from the resistance level of $3,435, with a target of $3,320 and

How to Get Forex Signals for Free in 2025?

How to Get Forex Signals for Free in 2025?

In the fast-paced world of Forex trading, timing and accuracy can make or break your strategy. That’s where live Forex signals come into play. These real-time alerts can guide traders on what to trade, when to enter, and when to exit — even if they don’t have years of technical experience. And the best part?

EUR/USD Analysis 11/08: Trading in Narrow Ranges (Chart)

Trading in Narrow Ranges (Chart)

Created on August 11, 2025 EUR/USD Analysis Summary Today Overall Trend: Preparing for an upward shift. Today’s EUR/USD Support Levels: 1.1600 – 1.1550 – 1.1470. Today’s EUR/USD Resistance Levels: 1.1700 – 1.1770 – 1.1860 EUR/USD Trading Signals: Buy EUR/USD from the support level of 1.1560, with a target of 1.1900 and a stop loss of

Nvidia pushes back on accusations its H20 chips pose a national security risk in China

Trump Nvidia, AMD China chip revenue deal implications

Nvidia and AMD have agreed to share some of their revenue from sales to China with the U.S. government, according to several reports, sparking debate about whether the move could impact the chip giants’ business and whether Washington might seek out similar deals. In exchange for 15% of revenues from the chip sales, the two

Nvidia Forex Signal 11/8: Threatens Another Breakout (Chart)

Nvidia Forex Signal 11/8: Threatens Another Breakout (Chart)

Created on August 11, 2025 Potential signal: If NVDA breaks above the $185 level, I’d be aiming for the $197 level. Stop loss at the $175 level. During the trading session on Friday, we have seen Nvidia rally again, as it looks like we are trying to break above the shooting star that formed on

USD/MXN Analysis 11/08: Mid-Term Low Challenged (chart)

USD/MXN Analysis 11/08: Mid-Term Low Challenged (chart)

Created on August 11, 2025 The USD/MXN continues to show a tendency to trend downwards and is near the 18.59800 ratio as of this writing with fast changes in values, this after going into the weekend with its low for the week and within sight of important support levels. After the USD/MXN traversed higher in