EUR/USD Analysis Summary Today
- Overall Trend: Weak upward correction.
- Support Levels for EUR/USD Today: 1.1600 – 1.1550 – 1.1480.
- Resistance Levels for EUR/USD Today: 1.1700 – 1.1780 – 1.1850.
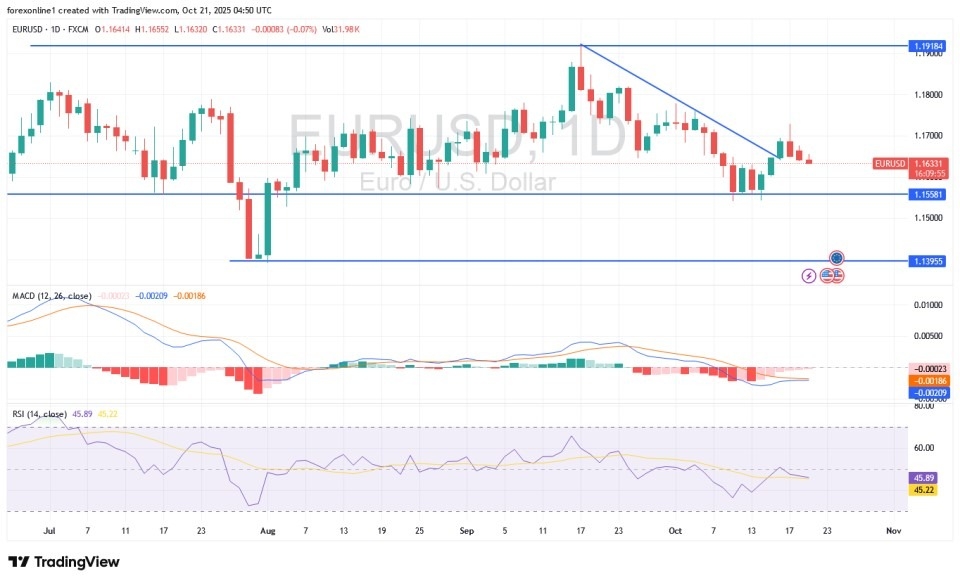
EUR/USD Trading Signals:
- Buy the EUR/USD from the support level of 1.1560, target 1.1800, and stop 1.1480.
- Sell the EUR/USD from the resistance level of 1.1730, target 1.1600, and stop 1.1800.
Technical Analysis of EUR/USD Today:
According to recent trading, the EUR/USD pair has broken through a key resistance area at the key psychological support level of 1.1600, indicating that the uptrend may be gaining momentum. However, the price appears to be retreating to this broken resistance level, which has now become support, potentially attracting more buyers willing to join the rally. According to reliable trading platforms, the current price zone corresponds to the 50% and 61.8% Fibonacci retracement levels at 1.1637 and 1.16157, respectively, extending from the previous swing low at 1.1545 to the swing high at 1.1728. These technical areas may be sufficient to control losses and trigger a rebound to or above the previous highs.
Consequently, if the broken resistance zone and the Fibonacci levels hold as a base, the EUR/USD pair may resume its ascent and could target the psychological upward level of 1.18000 later. On the other hand, a break below these support areas could indicate a weakening of the upward momentum, leading to a deeper correction toward the swing low.
Therefore, if the broken resistance area and Fibonacci levels hold as a bottom, the EUR/USD pair may resume its upward trend, potentially targeting the psychologically significant 1.18000 level later. Conversely, a break below these support areas could indicate weakening upward momentum, leading to a deeper correction towards the swing low. Meanwhile, the 100-period simple moving average (SMA) is below the 200-period simple moving average (SMA) on the short-term timeframe, suggesting that the strongest trend was previously downward. However, the price has broken both SMAs, indicating a potential shift in momentum. The 200-period simple moving average appears to be stabilizing, suggesting that upward pressure may be increasing.
The stochastic indicator is also rising from the oversold zone, reflecting a return of buying interest. The oscillator has plenty of room to rise before reaching the overbought zone, so buyers may take control for a longer period, bringing the EUR/USD pair back to the swing high or achieving new highs above 1.17288. The Relative Strength Index (RSI) is also trending upward from the mid-range, confirming the increasing upward momentum. As long as the oscillator maintains its upward trend, the price may continue to follow the same trend.
Trading Tips:
The bullish shift in EUR/USD is at its beginning. Therefore, the currency pair may be influenced by upcoming economic data and central bank commentary as traders assess monetary policy expectations for both regions, while the US government shutdown may further weigh on the US Dollar.
EUR/USD Trading Awaits US Inflation Figures
According to Forex trading, the euro appears to be better supported at this stage; it just needs something to spark a continued recovery. This spark could come from the release of US inflation data, scheduled for the end of the week. The US dollar is likely to decline if US inflation meets or falls below expectations, which would push the EUR/USD exchange rate to extend its recent recovery to 1.1750.
In general, Markets expect US CPI inflation to reach 3.1% in September, up from 2.9% in August, while core inflation is expected to reach 3.1%. Any reading above expectations will naturally strengthen the dollar, as investors will have no choice but to lower their expectations for future interest rate cuts, a development typically considered supportive of the US dollar. Before the US inflation data is released, the euro will be subject to the Eurozone Purchasing Managers’ Index (PMI) survey, which will provide insight into the region’s economic performance in October. A strong set of PMIs will support the euro against the dollar, as they will support the European Central Bank’s stance on maintaining interest rates at their current level.
Ready to trade our daily Forex analysis? We’ve made a list of the best forex trading platforms for beginners worth trading with.


