EUR/USD Analysis 21/08: Key Economic Readings (Chart)

EUR/USD Analysis Summary Today

  • Overall Trend: Neutral with a downward bias.
  • Today’s Support Levels: 1.1600 – 1.1550 – 1.1480.
  • Today’s Resistance Levels: 1.1680 – 1.1730 – 1.1800.

EUR/USD Analysis 21/08: Key Economic Readings (Chart)

EUR/USD Trading Signals:

  • Buy EUR/USD from the 1.1560 support level, with a target of 1.1800 and a stop-loss at 1.1500.
  • Sell EUR/USD from the 1.1730 resistance level, with a target of 1.1500 and a stop-loss at 1.1800.

EUR/USD Technical Analysis Today:

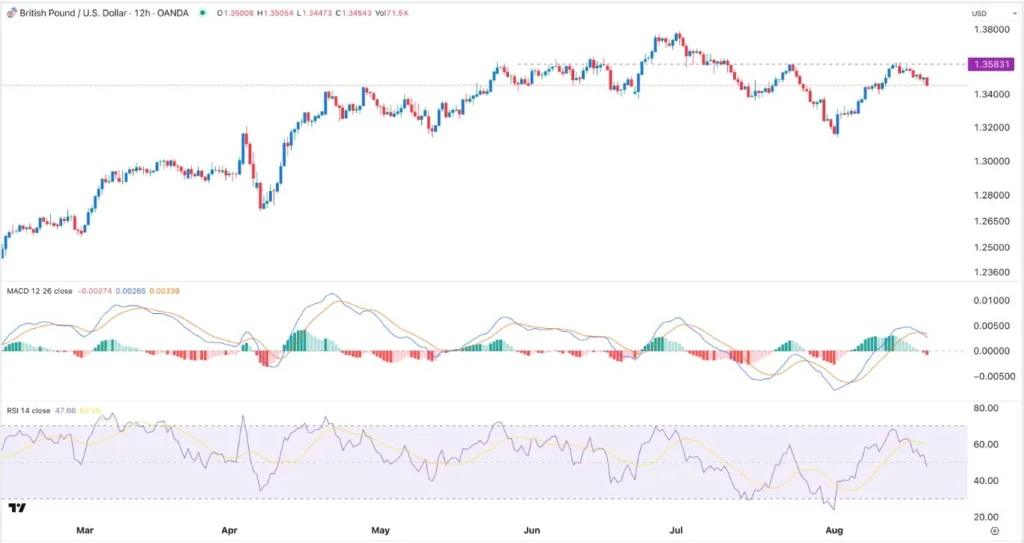
As expected, the EUR/USD pair is still under selling pressure until markets and investors react to what will be said at the Jackson Hole Symposium later this week. The focus will be on hints from global central bank officials, especially from the US Federal Reserve. According to reliable trading platforms, the EUR/USD pair has fallen to the 1.1625 support level, where it is consolidating at the time of writing.

The recent selling pressure on EUR/USD has pushed the 14-day Relative Strength Index (RSI) below the midpoint, which supports the bears in their further downward push. At the same time, the MACD indicator is preparing to move steadily downward.

According to the economic calendar, today’s session on Thursday, August 21, will be influenced by the release of Purchasing Managers’ Index (PMI) readings for both the manufacturing and services sectors of the Eurozone’s largest economies. The French readings are due at 10:15 AM Cairo time, the German readings at 10:30 AM Cairo time, and the overall Eurozone readings at 11:00 AM Cairo time.

On the US dollar side, the weekly US unemployment claims data will be announced at 3:30 PM Cairo time, followed by PMI readings for the manufacturing and services sectors at 4:45 PM Cairo time, and finally, the US existing home sales figures at 5:00 PM Cairo time.

Trading Tips:

Traders are advised to avoid trading EUR/USD for now and to await the reaction to today’s and tomorrow’s key data and events to get a clearer picture of the best entry levels for selling or buying. Avoid taking risks, no matter how strong the available trading opportunities seem.

European stock indices remain cautiously stable today

During today’s session, European stock markets are set to open with little change, as risk sentiment stabilizes. Investors are awaiting key signals from central banks and economic data. The market’s focus is on the US Federal Reserve’s annual Jackson Hole Symposium, where traders will scrutinize Fed Chair Jerome Powell’s remarks for any indication of whether the central bank will deviate from expectations of a near-term rate cut.

In Europe, attention will also be on the preliminary PMI reports for both the Eurozone and Britain, which will offer new insights into the region’s economic momentum. Meanwhile, the corporate calendar is relatively calm, with no major earnings reports scheduled.

In pre-market trading, futures contracts tied to the Euro Stoxx 50 and Stoxx 600 indices were stable, reflecting the cautious tone ahead of today’s events.

For additional & up-to-date info on brokers please see our Forex brokers list.

Source link

Visited 1 times, 1 visit(s) today

Related Article

Short sellers reap over $5 billion on Big Tech bets as AI fears roil market

Short sellers betting against some of the market’s leading AI stocks potentially made billions as markets slid this week and investors moved away from some of the year’s hottest tech trades. On Wednesday, tech stocks stumbled for a second day, with the tech-heavy Nasdaq Composite’s (^IXIC) 0.7% drop leading declines in the major averages as

GBP/USD Forex Signal: Bearish Pressure Builds (Chart)

GBP/USD Forex Signal: Bearish Pressure Builds (Chart)

Created on August 21, 2025 Bearish view Sell the GBP/USD pair and set a take-profit at 1.3350. Add a stop-loss at 1.3585. Timeline: 1-2 days. Bullish view Buy the GBP/USD pair and set a take-profit at 1.3585. Set a take-profit at 1.3350. The GBP/USD exchange rate pulled back for three consecutive days, even as the

NZD/USD Analysis Today 21/08: Bears in Control (Chart)

NZD/USD Analysis Today 21/08: Bears in Control (Chart)

Created on August 21, 2025 Price velocity downwards was sparked in the NZD on late Tuesday, and lows have been demonstrated the past day as the 0.58190 vicinity continues to be tested. The NZD/USD has shown a tendency to display bearish behavior the past couple of months. The selling action has not been a stable

Gold price technical analysis

Gold Price Holds Weak Tone Amid Fed, Geopolitical Risk

Gold price stays subdued with limited downside. Fed policy signals weighed on the gold as bets for aggressive easing faded. Markets now eye the Fed Chair speech and the Jackson Hole Symposium. Gold price stays under pressure in the early European session on Thursday with limited downside, as investors weigh Fed policy signals against persistent

EUR/GBP Weekly Outlook - Action Forex

NZD/USD Holds Near Four-Month Low

As today’s NZD/USD chart shows, the pair is trading near a four-month low following a sharp decline. The drop occurred yesterday after the Reserve Bank of New Zealand cut the official cash rate by 25 basis points to a three-year low of 3.0% and indicated that the rate could fall further to 2.55% by May

ForexIGO Coordinates Gold and GBP/USD in One Ruleset

ForexIGO Coordinates Gold and GBP/USD in One Ruleset

By DailyForex Press Release Created on August 21, 2025 MT4 Expert Advisor for XAUUSD and GBPUSD on M30; pattern-led entries confirmed by trend and momentum, with demo available. Quick View Limassol, Cyprus – August 2025 – ForexIGO unifies gold (XAUUSD) and GBPUSD within a single, structured approach on MetaTrader 4. It detects actionable patterns, validates

A stock price chart shown in red.

The Stock Market Has a Serious Problem (Besides President Trump’s Tariffs). History Says This Will Happen Next.

President Trump’s tariffs have tipped the economy toward stagflation, but investors have another serious problem in the stock market’s elevated valuation. U.S. stocks have been unusually volatile this year. The benchmark S&P 500 (^GSPC -0.24%) dropped more than 10% in two days in early April after President Trump outlined sweeping “Liberation Day” tariffs. Those rapid