EUR/USD Analysis Summary Today
- Overall Trend: Neutral with a bullish bias.
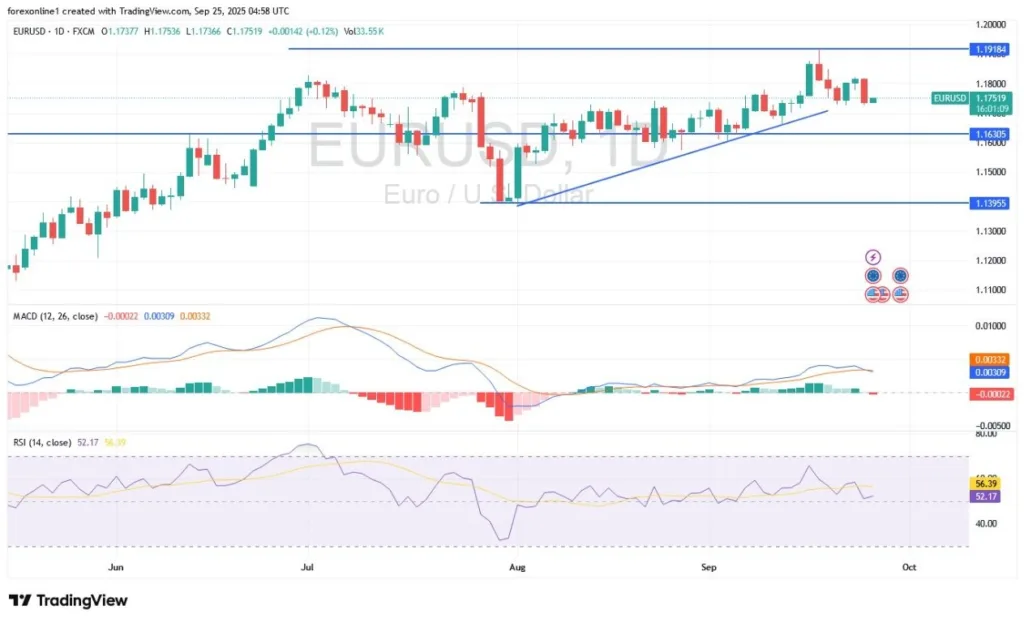
- Today’s Support Levels: 1.1680 – 1.1620 – 1.1540.
- Today’s Resistance Levels: 1.1775 – 1.1830 -1.1900.
")
EUR/USD Trading Signals:
Buy EUR/USD from the 1.1630 support level, with a target of 1.1800 and a stop-loss at 1.1550.
Sell EUR/USD from the 1.1800 resistance level, with a target of 1.1600 and a stop-loss at 1.1870.
Technical Analysis of EUR/USD Today:
The euro has continued to benefit from the market’s and investors’ reaction to the US inflation reading at the end of last week. The EUR/USD gains yesterday reached the 1.1736 resistance level before the pair settled around 1.1715 at the start of today’s session, Tuesday, September 2, 2025. This comes ahead of the euro area’s inflation reading, due at 12:00 PM Cairo time, followed by the US ISM Manufacturing PMI.
The Euro/US Dollar traded at the start of a new month, continuing its 0.8% gains in August and approaching its strongest levels since late July, influenced by the general weakness of the US dollar. Investors are monitoring US labor market data this week for clues about the extent of the Federal Reserve’s interest rate cut later this month. The US dollar was also negatively impacted by concerns about the independence of the US Federal Reserve, after a court hearing on President Trump’s attempt to remove Federal Reserve Governor Cook ended without a ruling, keeping her in her position for now.
Meanwhile, trade uncertainty has persisted, with US Trade Representative Jamieson Greer stating that talks with partners are ongoing despite a federal appeals court’s decision to declare most of Trump’s tariffs illegal. Last week, the European Commission proposed a repeal of tariffs on US industrial goods, a move that could retroactively lead to a reduction in US tariffs on European cars.
On the European political front, escalating unrest in France ahead of the September 8 confidence vote continued to dominate headlines.
EUR/USD Price Forecast:
The EUR/USD exchange rate appears to be trying to rise, but a technical barrier is hindering its gains. The euro is currently in a short-term period of strength against the US dollar, which is surprising given the ongoing uncertainty regarding French politics. Next week, a confidence vote in the French National Assembly is expected to lead to the collapse of the François Bayrou government, triggering a period of uncertainty in one of Europe’s most indebted nations. Analysts suggest that financial markets are nervous about France’s debt outlook, and this has led to periods of euro weakness in the past. One analyst noted that a test of the 1.1400 support level could be possible if the situation worsens.
However, markets learned a lot from the collapse of Michel Barnier’s government in December. At that time, the euro fell but quickly recovered after it became clear that France had the political mechanisms to move forward, even if the current government had limited power to initiate real change. With a specific precedent in place, markets seem more optimistic as next week’s events approach.
From an exchange rate perspective, this reminds us that the dollar is the tailspinner of the EUR/USD, and that the end of the exchange rate this week will depend on the performance of the dollar. August saw a decline in the US dollar as markets increased their expectations that the Federal Reserve would cut interest rates in September. As is well known, a weak economy allows for this reduction in borrowing costs, and Friday’s US jobs report is expected to include this reduction, opening the door to further cuts in the future.
Technically, a look at the charts shows that the EUR/USD pair has recently risen, but we have returned to a technical resistance level, which is the 78.6% Fibonacci retracement of the July EUR/USD decline at 1.1735. This Fibonacci level represents the upper limit of a narrow range that the EUR/USD pair has had difficulty breaking. It is a technical ceiling, and we are concerned that it will hold in the coming days.
However, a look at the broader technical picture suggests that it is expected to eventually give way. The EUR/USD is above the nine-day exponential moving average at 1.1672, which makes our forecast model for the current week positive. A break of the 78.6% Fibonacci level at 1.1735 would open the door for the July 24 high of 1.1788, before a retest of the 2025 peak at the 1.1830 resistance.
Overall, for the EUR/USD pair to return to its bullish peak, we need the continued erosion of the US dollar’s value, which is most likely linked to a gradual slowdown in the domestic economy as tariffs begin to have an effect. At the same time, growing concerns about the Fed’s independence will play a role in undermining the currency. Although the first half of 2025 was marked by a frantic sell-off of the US dollar, we expect any additional weakness to be a slow-burning story, which would put new multi-year highs on the table later in the year.
Trading Advice
Traders are advised to await the market’s reaction to the US jobs data at the end of the week to determine the most suitable entry levels for trading the EUR/USD, whether for selling or buying.
Ready to trade our Forex daily forecast? We’ve shortlisted the best forex broker list for you to check out.