Jerome Powell’s observation regarding equity valuations hits the nail on the head.
In spite of some early-year volatility fueled by tariff-related uncertainty, it’s turned out to be a stellar year for investors. The widely followed S&P 500 (^GSPC -2.71%) has recorded 32 new all-time highs this year, as of the closing bell on Oct. 6, with the iconic Dow Jones Industrial Average (^DJI -1.90%) and growth-propelled Nasdaq Composite (^IXIC -3.56%) pushing to numerous record-closing highs as well.
Wall Street and everyday investors have been enamored with the sky-high addressable markets attached to game-changing innovations like artificial intelligence and quantum computing, and are excited about the prospect of the Federal Reserve continuing with a rate-easing cycle designed to encourage corporate borrowing.
Despite all of these factors seemingly working in favor of the stock market, one sentence from Fed Chair Jerome Powell appears to have driven a dagger right through the heart of the current bull market — and there’s plenty of statistical data to back up his claim.

Fed Chair Jerome Powell speaking with President Trump. Image source: Official White House Photo by Daniel Torok.
Jerome Powell just put Wall Street’s biggest risk squarely in the spotlight
The Fed’s Board of Governors gives speeches on a fairly regular basis each month, and Powell is no exception.
In a recent speech delivered in Rhode Island, the Fed Chair was questioned about how the central bank’s governors weigh the performance of the stock market when formulating monetary policy. Though Powell normally sidesteps questions that have to do with equity valuations, or offers more of a boilerplate response, he directly addressed what can be viewed as the biggest historical risk to the stock market right now:
We do look at overall financial conditions, and we ask ourselves whether our policies are affecting financial conditions in a way that is what we’re trying to achieve. But you’re right, by many measures, for example, equity prices are fairly highly valued.
This six-word phrase, “equity prices are fairly highly valued,” is the dagger through the stock market’s heart that few heads of the Fed would dare utter.
It’s been almost 30 years since a Fed chairperson has directly insinuated that stock valuations are pushing historical limits. In December 1996, former Fed Chair Alan Greenspan gave a speech that coined the phrase “irrational exuberance” to describe the nearly parabolic climb of internet-driven stocks, along with the S&P 500 and Nasdaq Composite, following the mainstream adoption of the internet.
While “valuation” is a somewhat subjective term that’s going to differ from one investor to the next, there’s a laundry list of historical data points that suggest Jerome Powell has hit the nail on the head with his six-word analysis of equity markets.
Statistically speaking, this is one of the priciest stock markets in history
Last week, I highlighted perhaps the most-glaring apples-to-apples valuation comparison for the S&P 500 dating back more than 150 years: the S&P 500’s Shiller price-to-earnings (P/E) ratio, which you’ll also find referred to as the cyclically adjusted P/E ratio, or CAPE ratio.
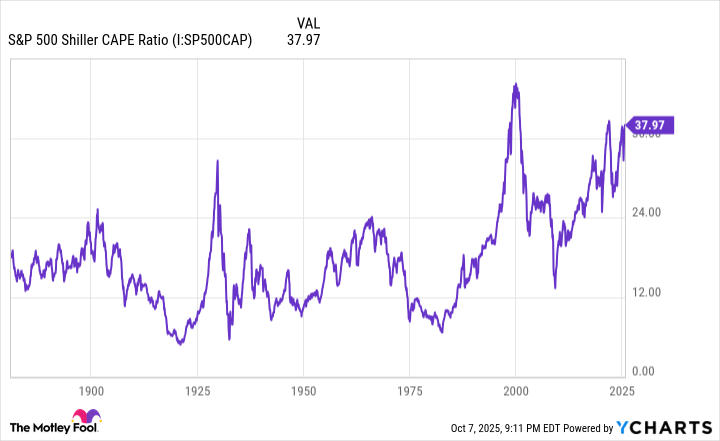
S&P 500 Shiller CAPE Ratio data by YCharts.
The Shiller P/E is based on average inflation-adjusted earnings over the trailing-10-year period. This means shock events and recessions, which are historically short-lived, don’t adversely skew this valuation tool in the same way recessions can make the traditional P/E ratio almost useless (at least for a short time frame).
On Oct. 6, the Shiller P/E closed at a multiple of 40.23, which marked its high point for the current bull market, and represents the second-priciest reading during a continuous bull market when back-tested to January 1871. The five previous occurrences where the S&P 500’s Shiller P/E ratio surpassed 30 and held this mark for at least two months were eventually followed by declines of 20% to 89% in the Dow, S&P 500, and/or Nasdaq Composite.
But this is just one of a growing list of historical metrics and correlative data points that appears to spell trouble for Wall Street.
Warren Buffett Indicator hits 220% for the first time in history 🚨🚨 The Stock Market topped at 190% during the Dot Com Bubble 🤯👀 pic.twitter.com/sGE9fAcHtR
— Barchart (@Barchart) September 20, 2025
The market-cap-to-GDP ratio, which is more affably known as the “Warren Buffett Indicator,” surpassed 221% this week, which makes for an all-time high, when back-tested to January 1970.
This metric, which the Oracle of Omaha once referred to as, “probably the best single measure of where valuations stand at any given moment,” has averaged a reading of 85% over the last 55 years. This is to say that the cumulative value of all stocks has equated to roughly 85% of U.S. gross domestic product (GDP). The stock market is currently trading at a 160% premium to this 55-year average, which may explain why Berkshire Hathaway‘s soon-to-be-retiring CEO, Warren Buffett, has been a persistent net-seller of stocks for nearly three years.
The S&P 500 is now trading at over 3.3x sales, its highest valuation in history. $SPX
Jerome Powell: “equity prices are fairly highly valued.”
Video: https://t.co/qcrSdy9zzo pic.twitter.com/IXd8FTtvkX
— Charlie Bilello (@charliebilello) October 1, 2025
The S&P 500’s trailing-12-month price-to-sales (P/S) ratio is also at its highest reading, when examined quarterly, dating back to the fourth quarter of 2000.
As the post above from Creative Planning Chief Market Strategist Charlie Bilello shows, the S&P 500’s P/S ratio of 3.33 is more than double the historical median P/S ratio of 1.6 over the last 25 years.
S&P 500 price-to-book ratio is extremely overvalued, surpassing the Dotcom bubble.
Market expects extraordinary earnings; they better not disappoint.
Hope this helps. pic.twitter.com/hv79wG3t8M
— The Great Martis (@great_martis) October 6, 2025
It’s a similar tale for the S&P 500’s price-to-book ratio. During the peak of the dot-com era, prior to the bursting of the bubble in March 2000, the S&P 500 topped out at 5.06 times the cumulative book value of its components. As of the fourth quarter of 2025, the price-to-book value of the S&P 500 has expanded to a multiple of more than 5.6.
By all historical accounts, stock market valuations are in rarified and likely unsustainable territory.
Patience is a virtue (and a bona fide recipe for making money on Wall Street)
Although Powell’s words ring true that stocks are pricey, which has historically been a formula for eventual significant downside in the Dow Jones Industrial Average, S&P 500, and Nasdaq Composite, Fed chairpersons have never been particularly successful at timing market downturns.
The stock market was, indeed, historically pricey when Greenspan made his irrational exuberance speech in December 1996. However, the growth-fueled Nasdaq Composite didn’t peak until more than three years later in March 2000. Just because the current Fed chair sees equity prices as “fairly highly valued,” it doesn’t mean the stock market is at or even near its short-term top.
More importantly, history overwhelmingly favors investors who think long term and maintain perspective.
The reason investing greats like Warren Buffett have been so successful for so long is because they understand investing is a simple numbers game. There’s no sense in getting worked up over stock market corrections, bear markets, or the occasional crash when, based on decades of history, the data shows downturns are short-lived.
Bespoke Investment Group compared the calendar-day length of every S&P 500 bull and bear market since the Great Depression began in September 1929 and found a significant disparity. Whereas the average S&P 500 bear market lasted approximately 9.5 months, the typical bull market stuck around two years and nine months, or the equivalent of 3.5 times longer.
Image source: Getty Images.
A separate analysis from Crestmont Research, which is updated annually, calculated the rolling 20-year annualized total returns of the S&P 500 dating back to 1900. Although the S&P wasn’t officially incepted until 1923, the total return, including dividends, of its components was tracked in other major indexes from 1900 to 1923 to gather the necessary data.
From 1900 to 2024, there have been 106 separate rolling 20-year periods (1900-1919, 1901-1920, and so on, to 2005-2024). All 106 periods provided investors with a positive annualized total return, which is to say that if an investor had, hypothetically, purchased a tracking index for the S&P 500 and held it for 20 years, they would have made money every time. No matter what the stock market throws the way of investors, be it a historically pricey market, recessions, depressions, pandemics, wars, and so on, patience and perspective have always led to profits for long-term-minded investors.
It’s something to keep in mind as Wall Street attempts to digest a painful truth from Fed Chair Jerome Powell.