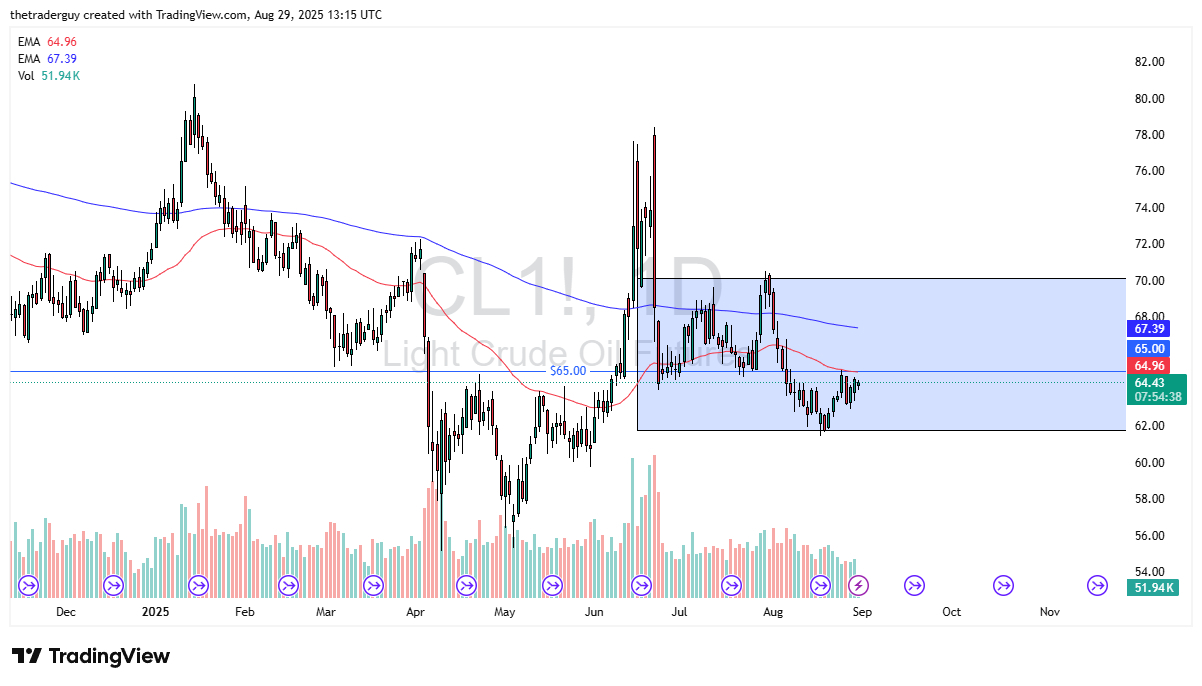
- The Light Sweet Crude Oil market went back and forth during the trading session on Friday, as we continued to dance around the $65 region.
- All things being equal, this is a market that is going to remain very noisy from everything I can see, and ultimately it makes a lot of sense that we could see a lot of back and forth and short-term trading.
- The market has a lot of different things going on at the same time, so I think you’ve got a situation where the volatility will be the norm.
Technical Analysis
The technical analysis for the Light Sweet Crude Oil market is somewhat mixed at the moment, which makes a certain amount of sense considering everything else that’s going on in the outside world. The $65 level continues to be a bit of a magnet for price, especially now that the 50 Day EMA is hanging right around that same level. If we can break above the 50 Day EMA, then the $66 level could be targeted.
If we pull back from here, I think there is plenty of support near the $63 level, and then after that the $62 level. In other words, I think we are in the middle of trying to form some type of consolidation area, but we just don’t know where that consolidation area is going to be at the moment. That being said, I do think that it does eventually find its range, and we go from there. With that being said, I would anticipate focusing on short term charts mainly, with no real directionality in the short term. If we continue to be stuck in this range, I think it will lead most oil traders to jump down to something like the 5 minute chart and simply scout.
External Pressure
Keep in mind that the United States, OPEC, and Russia are all pumping out as much crude oil as they can, and that will put a certain amount of downward pressure on price. Because of this, I am not looking for major blowouts to the top, but I also think there is a significant amount of support underneath. As long as the overall economic picture looks a little bit mixed as well, I think you have a substantial amount of overhanging in this market, keeping it somewhat sideways.
Ready to trade daily crude oil price analysis? We’ve shortlisted the best Forex Oil trading brokers in the industry for you.
Christopher Lewis has been trading Forex and has over 20 years experience in financial markets. Chris has been a regular contributor to Daily Forex since the early days of the site. He writes about Forex for several online publications, including FX Empire, Investing.com, and his own site, aptly named The Trader Guy. Chris favours technical analysis methods to identify his trades and likes to trade equity indices and commodities as well as Forex. He favours a longer-term trading style, and his trades often last for days or weeks.


