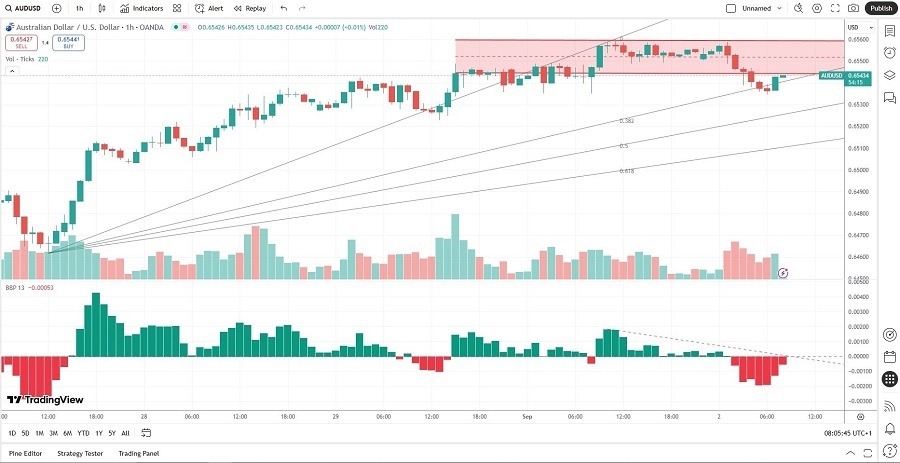
Control of Price Action (Chart)

Today’s AUD/USD Signals

Short Trade Ideas

  • Short entry between $0.65346 and $0.65601, the intra-day low of the breakdown and the upper band of its horizontal resistance zone.
  • Place your stop loss level 10 pips above your entry level.
  • Adjust the stop loss to break even once the trade is 25 pips in profit.
  • Take off 50% of the position as profit when the price reaches 25 pips in profit and leave the remainder of the position to run.

Long Trade Idea

  • Long entry if price action breaks out above $0.65701, ten pips above the upper band of its horizontal resistance zone, preferably following a successful re-test.
  • Place your stop loss level at 10 below your entry level.
  • Adjust the stop loss to break even once the trade is 25 pips in profit.
  • Take off 50% of the position as profit when the price reaches 25 pips in profit and leave the remainder of the position to run.

The best method to identify a classic “price action reversal” is for an hourly candle to close, such as a pin bar, a doji, an outside, or even just an engulfing candle with a higher close. You can exploit these levels or zones by watching the price action that occurs at the given levels.

AUD/USD Fundamental Analysis

AUDUSD Fundamental

Economic Data to Consider:

  • Australia’s second-quarter current account deficit came in at A$13.7 billion, better than the A$15.9 billion deficit expected, and below the upward-revised first-quarter deficit of A$14.1 billion.
  • The second quarter Australian net export contribution rose just 0.1%, below the expected 0.3%, but better than the 0.1% contraction reported in the first quarter.
  • Economists predict today’s US August S&P Global Manufacturing PMI to show a reversal from July’s 49.8 to 53.3, suggesting an expansion.
  • US July construction spending is predicted to show a contraction of 0.1%, following June’s drop of 0.4%.
  • The US August ISM Manufacturing PMI is expected to improve to 49.0 with the crucial Prices Paid component rising to 65.1, following July’s readings of 48.0 and 64.8, respectively.
  • Economists are upbeat about the US September IBD/TIPP Economic Optimism, expected to improve to 51.8 from August’s 50.9.

So, why am I bearish on the AUD/USD after its breakdown?

The six-hour bearish move from $0.65601, leading to a breakdown below its horizontal resistance zone, has more room to run, as bearish volumes have increased and confirmed the momentum shift.

Adding to bearish confirmation is the Bull Bear Power Indicator, which has been in bearish territory for seven hours and has been contracting for nine hours. The descending trendline could keep this technical indicator below the centerline.

I expect more downside with increased volatility. The AUD/USD could correct to its ascending 61.8% Fibonacci Retracement Fan level. US economic data may exacerbate US Dollar strength versus the Australian Dollar today. Forex traders should earn 25 to 40 pips from this short position.AUD/USD Forex Signal 02/09: Control of Price Action (Chart)AUD/USD Price Chart
Ready to trade our free Forex signals? Here is our list of the best Forex brokers in the world worth checking out.

Source link

Visited 1 times, 1 visit(s) today

Related Article

Senators grill Trump’s nominee for Fed post Stephen Miran : NPR

President Trump has nominated the chairman of his Council of Economic Advisers, Stephen Miran, to fill a short-term seat on the Federal Reserve’s governing board. Win McNamee/Getty Images North America hide caption toggle caption Win McNamee/Getty Images North America President Trump’s nominee to fill an open seat on the Federal Reserve board faced tough questions

3 fall prey to forex trade scam, lose around Rs28L

3 fall prey to forex trade scam, lose around Rs28L | Nashik News

Nashik: Three people were allegedly cheated of Rs27.7 lakh on the pretext of earning “fabulous returns” from forex trading, Nashik city cyber police officials said.Inspector Subhash Dhawale said the conmen contacted the victims in June and promised them high returns through foreign exchange investments. “The crooks called the victims separately and explained to them the

Automated Data Signal 04/09: Support Levels Hold? (Chart)

Created on September 04, 2025 Long Trade Idea Enter your long position between $294.59 (the lower band of its horizontal resistance zone) and $300.07 (yesterday’s intra-day high). Market Index Analysis Automated Data Processing (ADP) is a member of the NASDAQ 100 and the S&P 500. Both indices try to hold on near record highs, but

nyse trader red jacket looking at screen

New Stock Market Super Cycle Is Starting, How to Invest: Goldman Sachs

ANGELA WEISS / AFP 2025-09-04T09:35:01Z Share Facebook Email X LinkedIn Reddit Bluesky WhatsApp Copy link lighning bolt icon An icon in the shape of a lightning bolt. Impact Link Save Saved Read in app This story is available exclusively to Business Insider subscribers. Become an Insider and start reading now. Have an account? Log in.

Silver Forecast 04/09: Continues to Stretch (Chart)

Silver Forecast 04/09: Continues to Stretch (Chart)

Created on September 04, 2025 During the trading session on Wednesday, we have seen silver continue to stretch higher, although I’d be the first person to point out that we are running a little hot here, and I think that it is probably only a matter of time before we get some type of pullback.

News Update – Pre-Markets

5 things to know before the stock market opens Thursday

This is CNBC’s Morning Squawk newsletter. Subscribe here to receive future editions in your inbox. Here are five key things investors need to know to start the trading day: 1. Material moves Nearly 99% of S&P 500-listed companies have reported earnings for the quarter, according to FactSet. Several key names released results after the bell yesterday, including

Gold Forecast 04/09: Continues to Rally (Chart)

Gold Forecast 04/09: Continues to Rally (Chart)

Created on September 04, 2025 Gold has been positive during the Wednesday trading session again, as we continue to see plenty of bullish pressure. Ultimately, this is a market that looks very lively, and as it has just recently broken out of a significant consolidation range, one would also assume that momentum should continue to