BTC/USD Forex Signal Today 16/06: Bullish Breakout (Chart)

My previous BTC/USD signal on 9th June was not triggered, as there was no bearish price action at any of the identified resistance levels.

BTC/USD Forex Signal Today 16/06: Bullish Breakout (Chart)

Today’s BTC/USD Signals

Risk 0.50% per trade.

Trades must be entered prior to 5pm Tokyo time Tuesday.

Long Trade Ideas

  • Go long after a bullish price action reversal on the H1 timeframe following the next touch of $106,851, $104,502, or $103,091.
  • Put the stop loss $100 below the local swing low.
  • Move the stop loss to break even once the trade is $100 in profit by price.
  • Take off 50% of the position as profit when the trade is $100 in profit by price and leave the remainder of the position to run.

Short Trade Ideas

  • Go short after a bearish price action reversal on the H1 timeframe following the next entry into the zone between of $108,423, $109,029, or $110,463.
  • Put the stop loss $100 above the local swing high.
  • Move the stop loss to break even once the trade is $100 in profit by price.
  • Take off 50% of the position as profit when the trade is $100 in profit by price and leave the remainder of the position to run.

The best method to identify a classic “price action reversal” is for an hourly candle to close, such as a pin bar, a doji, an outside or even just an engulfing candle with a higher close. You can exploit these levels or zones by watching the price action that occurs at the given levels.

BTC/USD Analysis

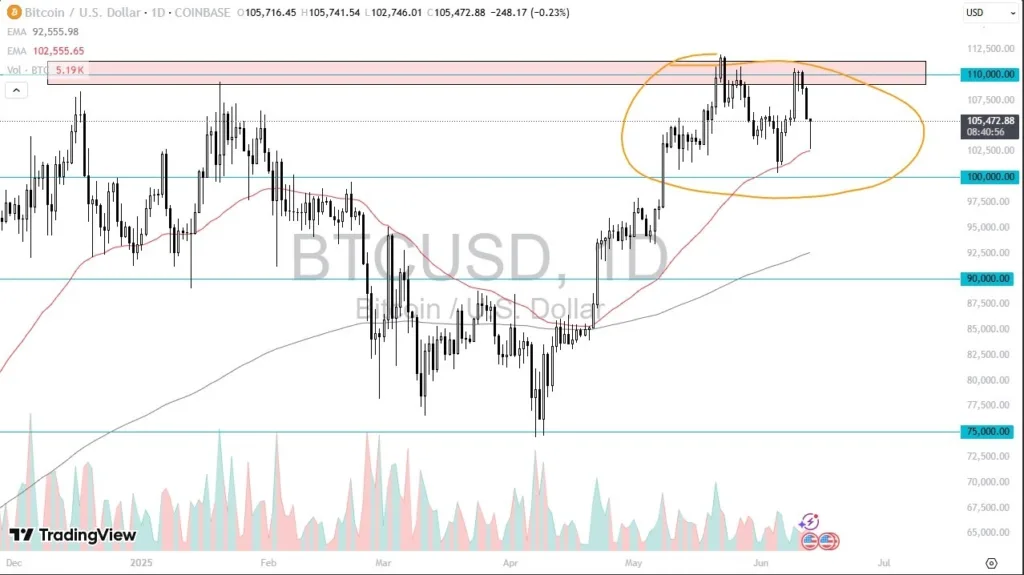
I wrote in my previous BTC/USD forecast on 9th June that I thought that the bulls had a minor edge, so the best trade setup would be a long trade entry from a bullish bounce off $104,165.

This was a good call although the price never traded as low as that support level, but it soared higher. I was wrong, however, in not wanting to enter a long trade in Bitcoin until a new all-time high was made, but that is my tried and tested long-term trading method which has a proven track record of profitability.

The technical picture is a little different now, but the technical outlook still seems to be bullish, with the price rising firmly over recent hours. Notably, the former key resistance level at $106,851 has been breached, and this may now act as support.

I cannot feel strongly bullish for two reasons:

The price action suggests overcoming the recent top near $110,000 is unlikely to happen any time soon, and
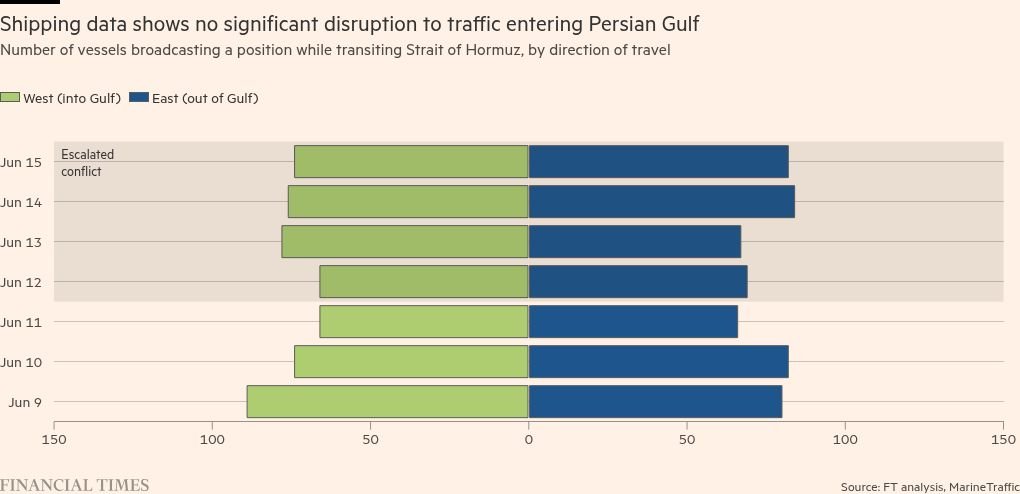
A regional escalation in the Middle East is quite possible and could sent risk sentiment tumbling, which will tend to hurt Bitcoin.

So, I think a short trade from a rejection of the resistance level at $108,423 (if it is reached today), will be the best opportunity which might set up today.

There is nothing of high importance due today regarding either Bitcoin or the US Dollar.

Ready to trade our daily Forex signals on Bitcoin? Here’s our list of the best MT4 crypto brokers worth checking out.

Source link

Visited 1 times, 1 visit(s) today

Related Article

Oil price falls back as flow of crude through Strait of Hormuz unaffected

Oil price falls back as flow of crude through Strait of Hormuz unaffected

Unlock the Editor’s Digest for free Roula Khalaf, Editor of the FT, selects her favourite stories in this weekly newsletter. Oil markets have shrugged off Israel’s threat to topple the Iranian regime, with crude exports from the Middle East so far unaffected by the escalating conflict. Financial Times analysis of ship-tracking data shows there has

China releases three US citizens in rare prisoner swap

European stock markets opened higher despite escalating Israel-Iran conflict

ADVERTISEMENT Israel’s attack on Iranian nuclear and military targets caused the price of oil to surge more than 7% on Friday since Tehran is one of the world’s major producers of oil, despite sanctions by Western countries limiting its sales. A wider war could slow the flow of Iranian oil to its customers and keep

OnePrime Appoints Katalina Pantea as Head of Compliance

OnePrime Appoints Katalina Pantea as Head of Compliance

By DailyForex Press Release Created on June 16, 2025 Sydney, Australia – June 12, 2025 – OnePrime, a brand operated within the OneRoyal Group by Royal Financial Trading Pty Ltd, is pleased to announce the appointment of Katalina Pantea as its new Head of Compliance. With over two decades of experience in regulatory compliance, anti-money

America will enter a war in the Middle East if a single U.S. base is hit, analyst warns

Markets could be underpricing risks of Israel-Iran conflict

Fire and smoke rise into the sky after an Israeli attack on the Shahran oil depot on June 15, 2025 in Tehran, Iran. Getty Images | Getty Images News | Getty Images Global investors may be underpricing the impact of a conflict between Israel and Iran, market watchers warned on Monday, as stocks rallied despite escalating warfare

BTC/USD Signal Today 16/06: Bounces from 50-Day EMA (Chart)

Bounces from 50-Day EMA (Chart)

Potential signal: At this point, I am willing to buy Bitcoin, but I also recognize that you will have to pay close attention to the 50 Day EMA. That could be your stop loss. I would be aiming for the $110,000 level to take profit, and then I would move my stop loss to break

A person looking at a laptop PC with a digital circuit image superimposed.

Will IonQ Stock Trounce Palantir in the Second Half of 2025?

Few stocks have been as hot as Palantir Technologies (PLTR 1.64%) in 2025. Shares of the artificial intelligence (AI) software company have skyrocketed close to 80% year to date. However, if we only look at the last three months, IonQ (IONQ -2.38%) has been an even bigger winner than Palantir. Will IonQ stock trounce Palantir

USD/ZAR Analysis Today 16/06: Liquidity Warning (Chart)

USD/ZAR Analysis Today 16/06: Liquidity Warning (Chart)

The USD/ZAR saw a spike on early Friday as global Forex markets turned risk adverse, but the currency pair has come off near-term highs and has resumed its lower range as concerns persists. Traders need to know that South Africa is celebrating a national holiday today, which means financial institutions from the nation will be

USD/MXN Today 16/06: Watch Energy, Risk Shifts (Chart)

Watch Energy, Risk Shifts (Chart)

The USD/MXN has seen a rather solid trading range emerge the past handful of days, and as of this morning the currency pair is around the 18.88875 depending on fluctuations being demonstrated. The USD/MXN has provided traders with a rather tempting range the past handful of days. This doesn’t mean it is particularly safe to

0
Would love your thoughts, please comment.x
()
x