BTC/USD Forex Signal 18/08: Double-Top Pattern (Chart)

Bearish view

  • Sell the BTC/USD pair and set a take-profit at 112,000.
  • Add a stop-loss at 123,500.
  • Timeline: 1-2 days.

Bullish view

  • Buy the BTC/USD pair and set a take-profit at 123,500.
  • Add a stop-loss at 112,000.

BTC/USD Forex Signal 18/08: Double-Top Pattern (Chart)

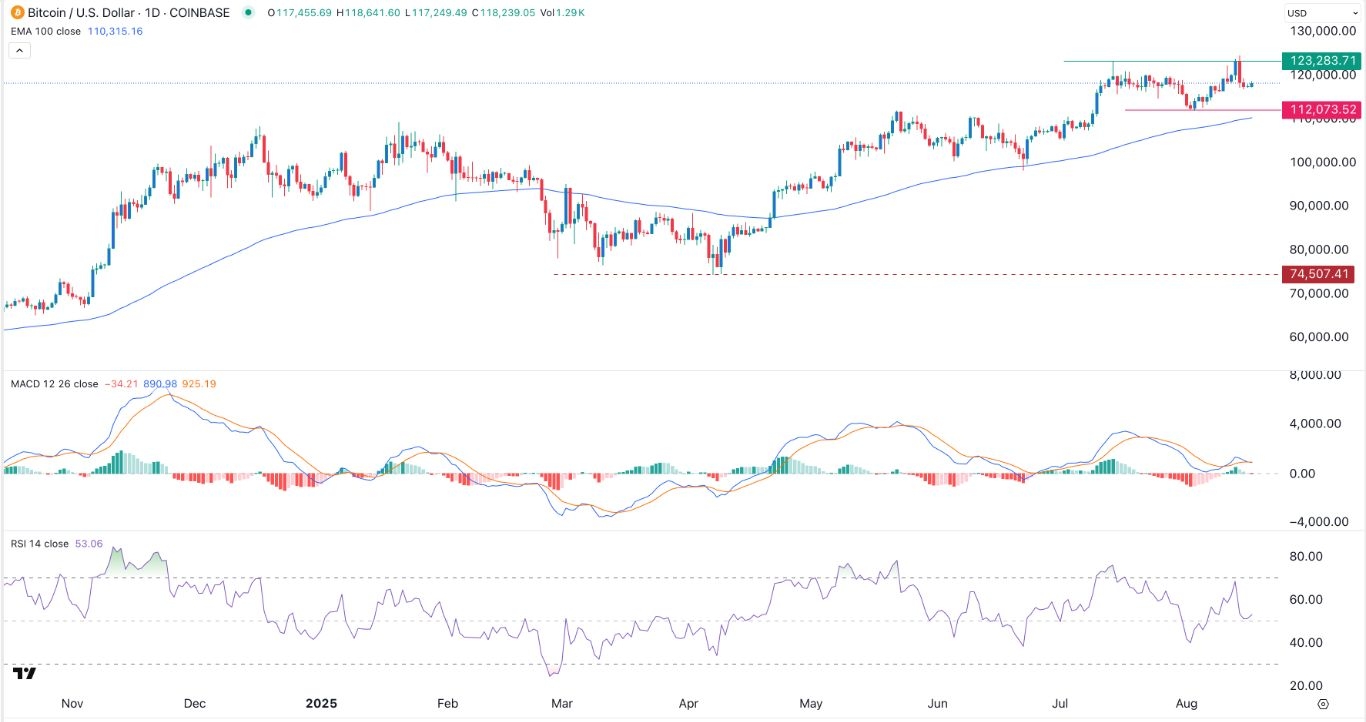
Bitcoin price moved sideways on Monday morning as the recent bullish momentum faded. The BTC/USD pair was trading at 118,230, lower than the year-to-date high of 124,200.

Bitcoin’s strong rally stalled after the strong US consumer and producer inflation data released last week which pushed investors to pare back their Federal Reserve interest rate cut odds.

The headline CPI figure remained unchanged at 2.7%, while the core consumer price index jumped to 3.1%, the highest level in months.

Meanwhile, the headline producer price index (PPI) rose to 3.6% in July as the cost of doing business in the US escalated. These numbers pushed Wall Street analysts to scale back their interest rate cuts hopes. The odds that the bank will cut rates in September fell to 70% from nearly 100% earlier during the week.

Bitcoin price will likely react to the upcoming Jackson Hole Symposium in Wyoming, which will provide more hints on when the bank will cut interest rates.

The BTC/USD pair also reacted to the ongoing focus on Ethereum among Wall Street investors. Data shows that spot Bitcoin ETFs added a net $547 million last week, much lower than Ethereum’s $2.85 billion.

Bitcoin price will also react to the ongoing BTC treasury strategy in which companies are adding BTC tokens into their balance sheet as they mimic Strategy (MSTR), which has become the biggest companies with a valuation of over $100 billion.

BTC/USD Technical Analysis

The daily chart shows that the BTC/USD pair pulled back from the year-to-date high of 124,420 to the current 118,300. It remains much higher than the 50-day and 100-day Exponential Moving Averages (EMA), which is a positive sign.

However, the pair’s oscillators have moved sideways. The MACD indicator has remained above the zero line, while the RSI has dropped to 50.

The BTC/USD pair has formed a double-top pattern at 123,283 and the neckline at 112,000. This is one of the most common bearish chart patterns.

Therefore, the pair will likely pull back as bears target the neckline at 112,00. A move above the resistance at 123,280 will invalidate the bearish outlook

Ready to trade our free Forex signals? Here are the best MT4 crypto brokers to choose from.

Crispus Nyaga is a financial analyst, coach, and trader with more than 8 years in the industry. He has worked for leading companies like ATFX, easyMarkets, and OctaFx. Further, he has published widely in platforms like SeekingAlpha, Investing Cube, Capital.com, and Invezz. In his free time, he likes watching golf and spending time with his wife and child.

Source link

Visited 1 times, 1 visit(s) today

Related Article

ForexEKO Streamlines Candlestick Trading for Gold

ForexEKO Streamlines Candlestick Trading for Gold

By DailyForex Press Release Created on August 20, 2025 MT4 Expert Advisor for XAU/USD that automates pattern detection and routes decisions through clear, rule-based execution. Limassol, Cyprus – August 2025 – ForexEKO applies a structured, data-driven approach to candlestick trading on gold (XAU/USD). It automates the recognition of key formations and connects them to a

Weakens as Dollar Holds Firm (Video)

Weakens as Dollar Holds Firm (Video)

Created on August 20, 2025 The British pound initially trying to rally during the trading session here on Tuesday but has given back those gains pretty quickly. Ultimately, I think you’ve got a scenario where traders are going to look at this through the prism of a potential downtrend tying to form. And I am

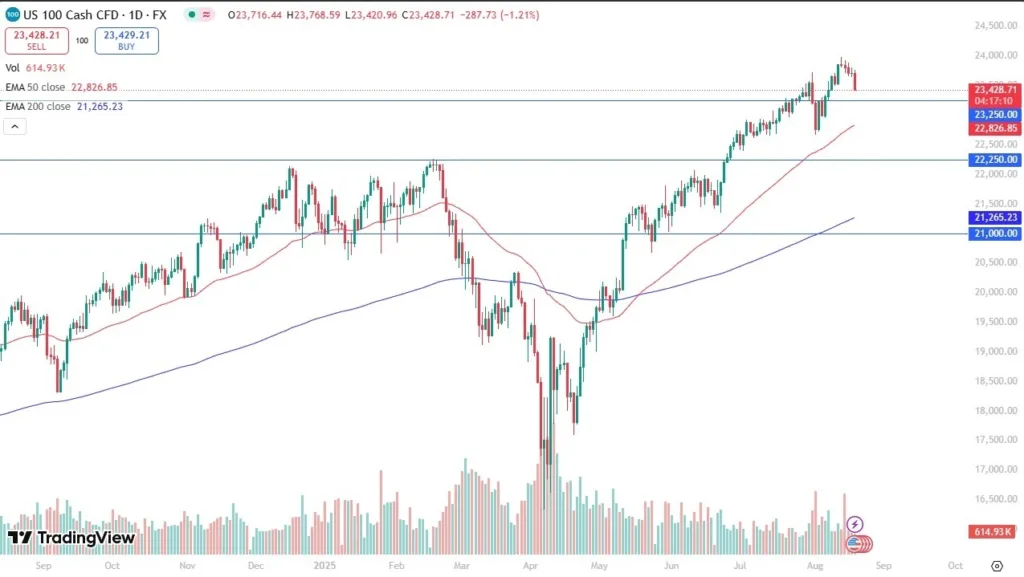
Falls as Traders Eye Support (Video)

Falls as Traders Eye Support (Video)

Created on August 20, 2025 You can see that the NASDAQ 100 fell really hard during the trading session here on Tuesday as traders continue to sell off from extreme highs, all things being equal. This is a market that will be looking towards the 23,250 level for some type of support. Traders are looking

Avexbot Sets a Clear Data Standard for GBP/USD Automation

Avexbot Sets a Clear Data Standard for GBP/USD Automation

By DailyForex Press Release Created on August 20, 2025 MT4 Expert Advisor with candlestick-based analysis and rule-driven execution on M15; demo available for evaluation. Limassol, Cyprus – August 2025 – Traders don’t just need more signals; they need cleaner ones that hold up when conditions shift. Avexbot, an MT4 Expert Advisor focused on GBP/USD, pairs

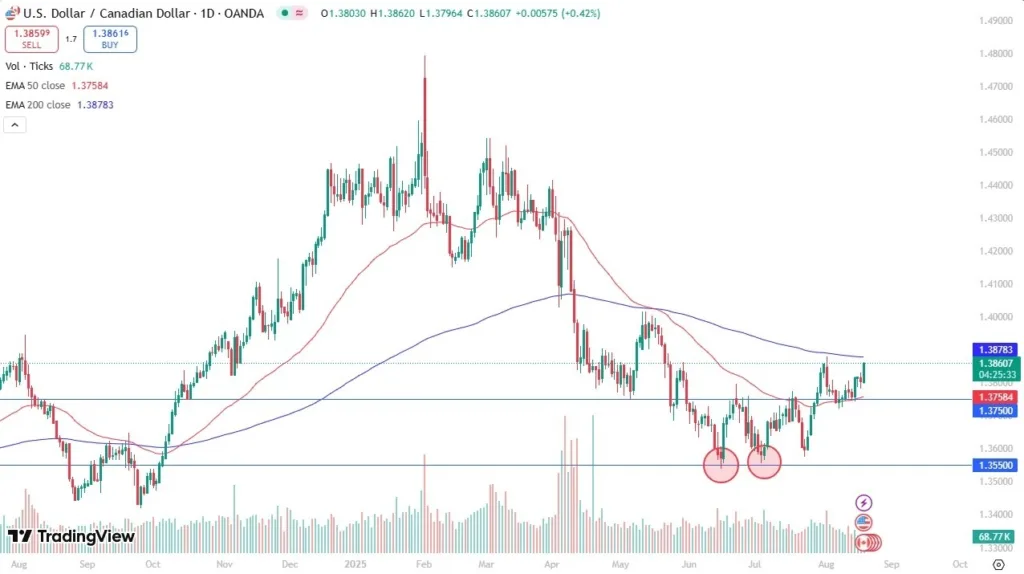
USD/CAD Forex Signal 20/08: Eyes Breakout (graph)

USD/CAD Forex Signal 20/08: Eyes Breakout (Video)

Created on August 20, 2025 Potential signal: I am a buyer of the USD/CAD pair on a break over the 200 Day EMA, with a stop loss of 100 points. I have a target of 1.3980 above. The US dollar has risen quite nicely against the Canadian dollar during the trading session on Tuesday to

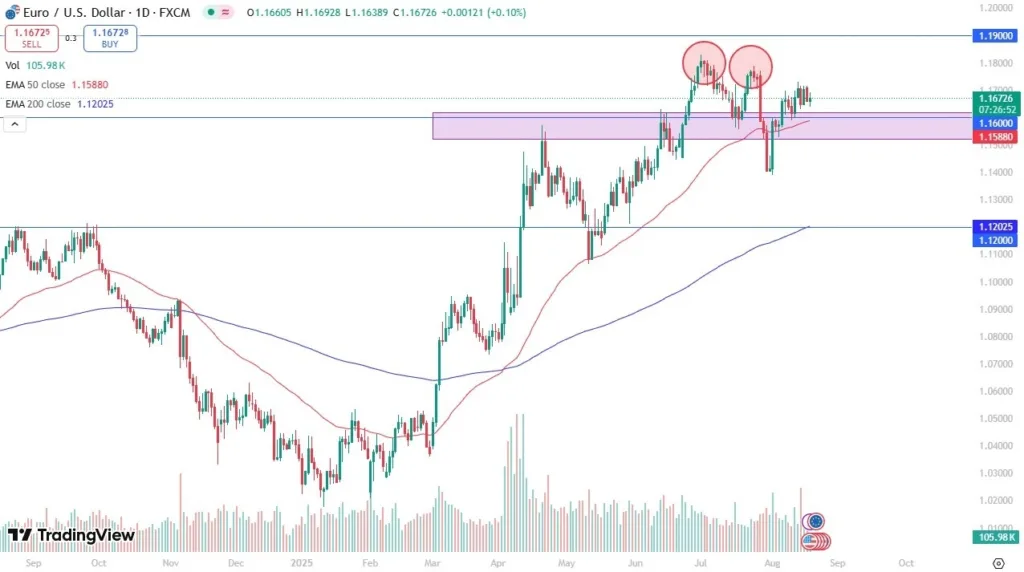
EUR/USD Forecast Today 20/08: Attempts Recovery (Chart)

EUR/USD Forecast Today 20/08: Attempts Recovery (Chart)

Created on August 20, 2025 The euro has been slightly positive during the early hours here on Tuesday, as we continue to see a lot of noisy behavior coming out of the Forex markets, especially as traders are trying to get an idea as to where monetary policy is going to be with the Americans.

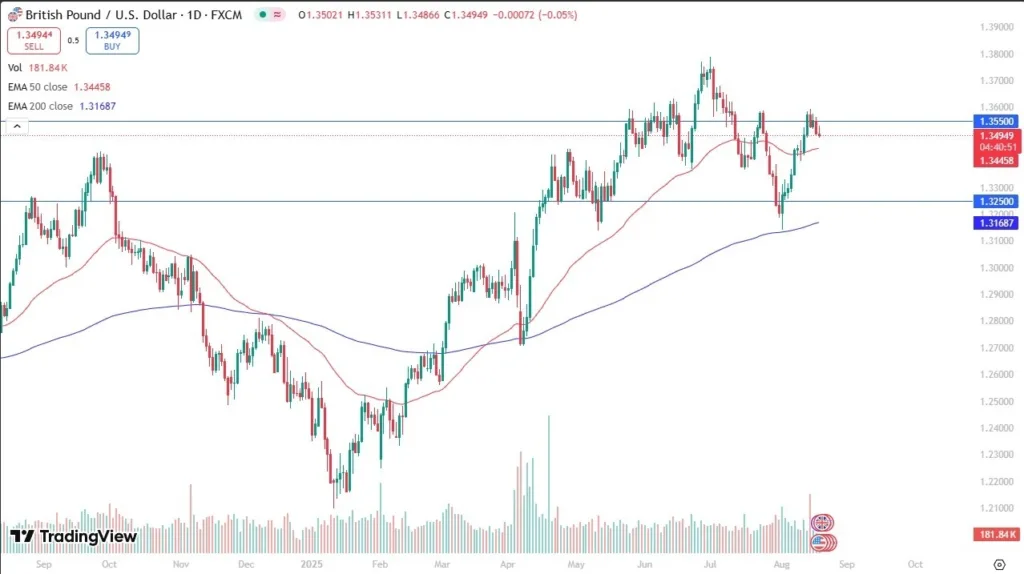
GBP/USD Forex Signal 20/08: Double Top Pattern Forms (Chart)

Double Top Pattern Forms (Chart)

Created on August 20, 2025 Bearish view Sell the GBP/USD pair and set a take-profit at 1.3350. Add a stop-loss at 1.3595. Timeline: 1-2 days. Bullish view Buy the GBP/USD pair and set a take-profit at 1.3595. Add a stop-loss at 1.3350. The GBP/USD exchange rate pulled back for two consecutive days as traders focused