Bounces from 50-Day EMA (Chart)

Potential signal:

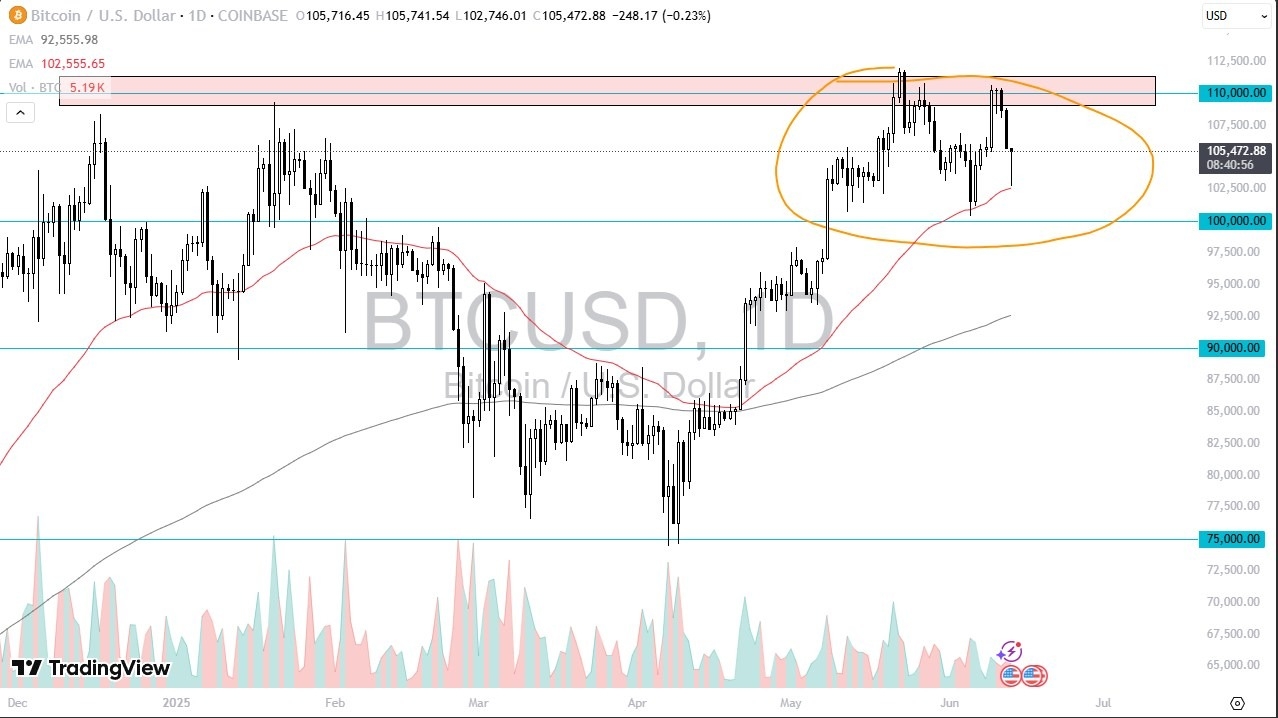
  • At this point, I am willing to buy Bitcoin, but I also recognize that you will have to pay close attention to the 50 Day EMA.
  • That could be your stop loss. I would be aiming for the $110,000 level to take profit, and then I would move my stop loss to break even.

BTC/USD Signal Today 16/06: Bounces from 50-Day EMA (Chart)

The Bitcoin market initially fell during the trading session on Friday, which makes a certain amount of sense considering we were decidedly “risk off”.

We saw a lot of different markets get hammered, and of course Bitcoin is pretty far out on the risk appetite spectrum, so with that being the case, I think you’ve got a situation where traders will continue to look at this through the prism of a market that is trying to get back to the all-time highs, but we also have to work off some of the excess froth that we had seen previously.

Technical Analysis

The technical analysis for Bitcoin is obviously relatively bullish, as the $110,000 level looks to be a major barrier to overcome, and it is worth noting that every time we pull back, buyers seem to be willing to jump in and take advantage of “cheap Bitcoin.” Because of this, you will have to pay close attention to the fact that there are people willing to take advantage of these set ups, so with this being said and the fact that we have bounce from the crucial 50 Day EMA, it looks a lot like a market that is going to do everything it can to build up enough pressure to break out.

If we do break out above the $112,000 level, then it’s likely that we go looking to the $120,000 level in fact, if you look at the recent consolidation between the $100,000 level and the $110,000 level, then you get the measured move to that $120,000 target. Quite frankly, I think we go higher than that, but in the short term that might be what we actually aim for. If we were to break down from here, perhaps below the $100,000 level, then I would have to look at the possibility of a move down to the 200 Day EMA, near the $93,000 level.

Ready to trade our free trading signals? We’ve made a list of the best Forex crypto brokers worth trading with.

Source link

Visited 1 times, 1 visit(s) today

Related Article

Bybit Launches Seamless Trading Across Stocks, Crypto and FX

Bybit Launches Seamless Trading Across Stocks, Crypto and FX

TLDR Bybit now supports stocks, crypto, and forex trading. Trade 78 stock CFDs like Apple and Tesla in one app. No MT5 needed — use one account for all markets. Get 50% off stock CFD fees until June 23, 2025. Bybit aims to become a global financial platform. Bybit has launched a new feature that

Stock Market Outlook: 3 Ways Israel-Iran Conflict Could Spark 20% Drop

US stocks appear to be digesting the initial shock of Israel’s attack on Iran and the subsequent retaliation by Tehran, but there are three ways the conflict could drag the stock market down, RBC says. Altogether, headwinds from the conflict could drag the S&P 500 down to 4,800-5,200 range, the bank wrote in a note

Bybit TradFi launches as crypto exchange adds FX and CFDs trading

Bybit TradFi launches as crypto exchange adds FX and CFDs trading

Bybit, the world’s second-largest cryptocurrency exchange by trading volume, has announced the launch of Bybit TradFi, marking what the company calls another milestone in the crypto-native platform’s evolution toward becoming a comprehensive financial destination that serves all customer needs. Bybit TradFi launch Through Bybit TradFi the major crypto exchange will be offering trading access to

Retirement Accounts Are Secret Weapon for New Stock Market Records: GS

Retirement Accounts Are Secret Weapon for New Stock Market Records: GS

For US households, there’s still no alternative to the stock market. The TINA trade in stocks — which stands for There Is No Alternative — was thought to be waning in recent years as rising interest rates since 2022 boosted bond yields for the first time in years, giving investors another option to lock in

EUR/USD Mid-Day Outlook - Action Forex

EUR/USD Mid-Day Outlook – Action Forex

Daily Pivots: (S1) 1.1491; (P) 1.1552; (R1) 1.1616; More… Intraday bias in EUR/USD remains neutral and more consolidations could be seen below 1.1630 temporary top. Further rise is expected as long as 1.1372 support holds. Break of 1.1572 will extend the rally from 1.0176. Next target is 61.8% projection of 1.0176

Oil price falls back as flow of crude through Strait of Hormuz unaffected

Oil price falls back as flow of crude through Strait of Hormuz unaffected

Unlock the Editor’s Digest for free Roula Khalaf, Editor of the FT, selects her favourite stories in this weekly newsletter. Oil markets have shrugged off Israel’s threat to topple the Iranian regime, with crude exports from the Middle East so far unaffected by the escalating conflict. Financial Times analysis of ship-tracking data shows there has

0
Would love your thoughts, please comment.x
()
x