My previous BTC/USD signal on 30th July was not triggered as none of the key support levels were reached.
Today’s BTC/USD Signals
Risk 0.50% per trade.
Trades may only be entered prior to 5pm Tokyo time Tuesday.
Long Trade Ideas
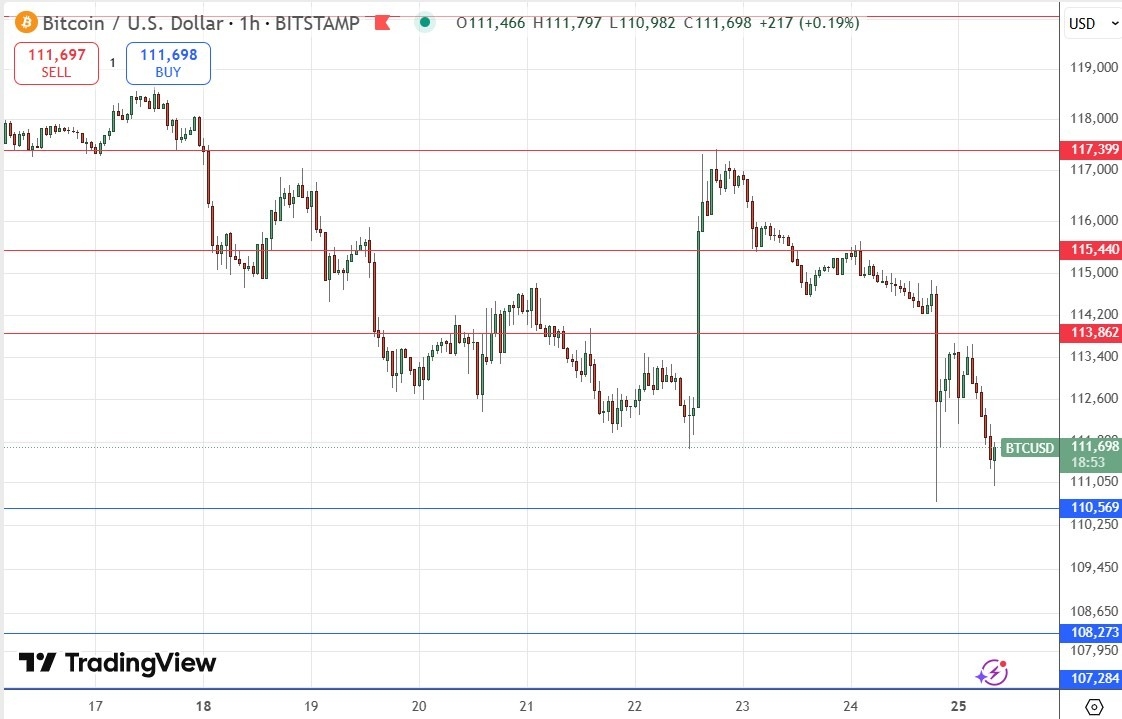
- Go long after a bullish price action reversal on the H1 timeframe following the next touch of $110,569 or $108,273.
- Put the stop loss $100 below the local swing low.
- Move the stop loss to break even once the trade is $100 in profit by price.
- Take off 50% of the position as profit when the trade is $100 in profit by price and leave the remainder of the position to run.
Short Trade Ideas
- Go short after a bullish price action reversal on the H1 timeframe following the next touch of $113,862 or $115,440.
- Put the stop loss $100 above the local swing high.
- Move the stop loss to break even once the trade is $100 in profit by price.
- Take off 50% of the position as profit when the trade is $100 in profit by price and leave the remainder of the position to run.
The best method to identify a classic “price action reversal” is for an hourly candle to close, such as a pin bar, a doji, an outside or even just an engulfing candle with a higher close. You can exploit these levels or zones by watching the price action that occurs at the given levels.
BTC/USD Analysis
I wrote in my previous BTC/USD forecast on 30th July that price was consolidating below a key resistance level at $120,055 and was likely building for an eventual explosive breakout, although I was concerned that the all-time high at about $123,000 could be a barrier.
The explosive breakout did finally come some days later, but it flopped quite quickly.
Since then, Bitcoin has turned more bearish, and in the past few days has really started to drop.
The long-term bullish trend will be over in almost all trend-trading methodologies, and in recent hours the price has been falling firmly towards the key support level just above the big round number at $110,000.
As the London session got underway today, there were initial signs of support, and if the price does make a double bottom in this area, it would not be a big surprise. However, it does not look likely that bulls will be able to make a lot of progress from this area, at least not quickly over the near term.
So, my analysis is that a bullish bounce off $110,569 could be good for a small long scalp, but a real bearish breakdown below $110,569 could be a good opportunity for a longer-term short trade, maybe on a swing trading time scale.
The support at $110,569 looks likely to be today’s pivotal point.
There is nothing of high importance due today regarding either Bitcoin or the US Dollar.
Ready to trade our free Forex signals on Bitcoin? Here’s our list of the best MT4 crypto brokers worth checking out.


