Australian Dollar Strengthens Following RBA Decision

Today, the AUD/USD pair experienced a spike in volatility. According to ForexFactory, analysts had forecast that the Reserve Bank of Australia (RBA) would cut interest rates from 3.85% to 3.60%. However, the market was caught off guard as the central bank opted to keep rates unchanged.

The RBA stated the following:

→ It remains cautious in its inflation outlook and awaits further evidence confirming that inflation is on track to return to the 2.5% target.

→ The decision to hold the rate was made by a vote of six to three — a rare instance of a split opinion among committee members.

The initial market reaction to the RBA’s unexpected move was a sharp appreciation of the Australian dollar. However, this was followed by a quick pullback in the minutes that followed (as indicated by the arrows).

Technical Analysis of the AUD/USD Chart

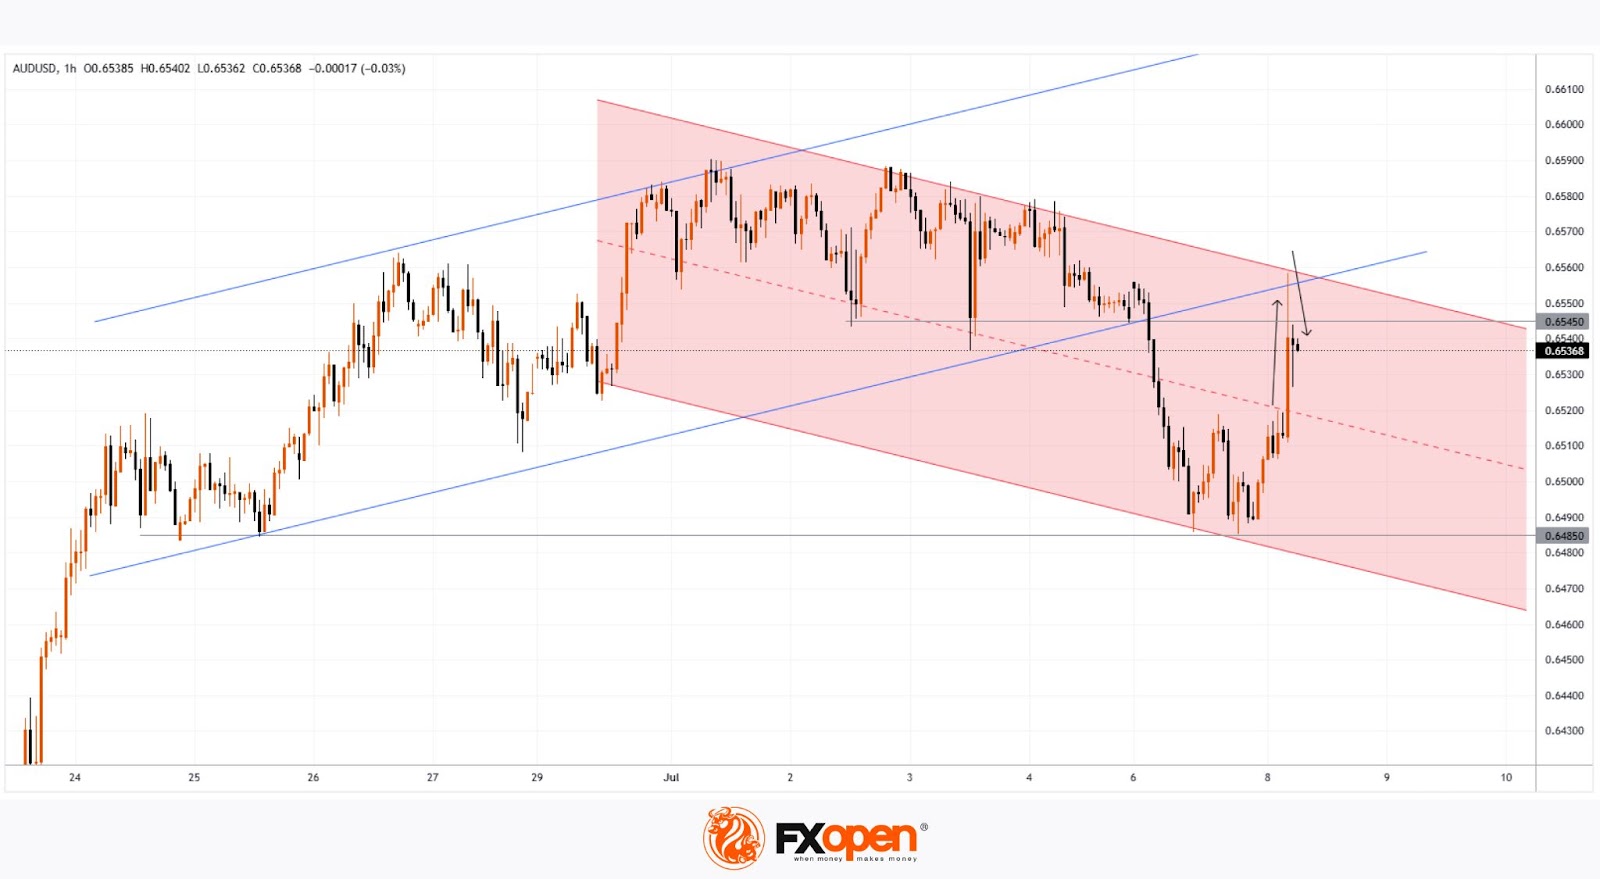
Since early July, price action in AUD/USD has been forming a descending channel (marked in red). In this context:

→ Today’s sharp rally and subsequent retracement underscored the significance of the upper boundary of the channel;

→ The pair tested a previously broken ascending trendline (the lower line of the blue channel);

→ Although the price briefly rose above the 0.65450 level, this area may now act as resistance going forward.

There is a possibility that, as forex trading unfolds throughout the day, AUD/USD could retreat towards the median line of the descending channel. Such a move could be interpreted as follows:

→ The initial reaction to the RBA decision may have been premature;

→ Selling pressure persists, which might trigger a move towards the support zone near 0.64850.

Looking ahead, the trajectory of AUD/USD in July 2025 will be largely influenced by developments surrounding a potential trade agreement between the United States and other countries, including Australia.

Trade over 50 forex markets 24 hours a day with FXOpen. Take advantage of low commissions, deep liquidity, and spreads from 0.0 pips. Open your FXOpen account now or learn more about trading forex with FXOpen.

This article represents the opinion of the Companies operating under the FXOpen brand only. It is not to be construed as an offer, solicitation, or recommendation with respect to products and services provided by the Companies operating under the FXOpen brand, nor is it to be considered financial advice.

Source link

Visited 1 times, 1 visit(s) today

Related Article

image

Stuck in a Range (Chart)

Bullish view Buy the BTC/USD pair and set a take-profit at 112,000. Add a stop-loss at 105,000. Timeline: 1-2 days. Bearish view Sell the BTC/USD pair and set a take-profit at 104,000. Add a stop-loss at 112,000. Bitcoin price was stuck in a range, continuing a trend that has been going on in the past

Montage of Donald Trump and some charts

Wall Street turns more bullish on US stocks despite Donald Trump’s tariff threats

Stay informed with free updates Simply sign up to the US equities myFT Digest — delivered directly to your inbox. Wall Street banks are turning more bullish on US stocks, despite President Donald Trump’s renewed threats of steep tariffs on major trading partners, with most big companies expected to shrug off the turmoil in the

ET logo

Former Sebi chief Madhabi Buch slams claims of regulatory failure in Jane Street case

Former SEBI Chairperson Madhabi Puri Buch has pushed back against allegations of regulatory failure, calling them a false narrative. She clarified that the regulator had, in fact, identified index manipulation by Jane Street and initiated several actions — including a cease-and-desist order — between April 2024 and February 2025. In a press statement issued today,

U.S. President Donald Trump gestures, as he speaks from a balcony, on the day he is expected to sign a sweeping spending and tax legislation, known as the "One Big Beautiful Bill Act," at the White House in Washington, D.C., U.S., July 4, 2025.

Global stock markets call president’s bluff

WASHINGTON, DC – JULY 7: An aide picks up a page from a letter to Japan and South Korea, signed by U.S. President Donald Trump, announcing 25% tariffs beginning on August 1st, during the daily press briefing in the Brady Press Briefing Room at the White House on July 7, 2025 in Washington, DC. Andrew

USD/JPY technical forecast

USD/JPY Price Analysis: Tarriffs Trigger Economic Woes for Japan

The USD/JPY price analysis indicates growing concerns about the state of Japan’s economy. Trump sent letters to some countries, including Japan and South Korea, notifying them of higher tariffs. Some major partners, such as the European Union, may not face higher tariffs. The USD/JPY price analysis indicates growing concerns about the state of Japan’s economy

It Must Be Unicorns – Action Forex

We’re back to square one in terms of the US tariff disaster, as the US has started sending letters to countries revealing their tariff rates—and the rates don’t look much different from those announced on the so-called Liberation Day. 25% for South Korea and Japan, 25% for Malaysia; 30% for South Africa; and 40% for

AUD/USD technical outlook

AUD/USD Outlook: Aussie Dollar Surges on Surprise RBA Pause

The AUD/USD outlook shows a sharp rebound in the Australian dollar. The Reserve Bank of Australia stunned markets by keeping interest rates unchanged. Trump sent out tariff letters to some of the US’s major trading partners. The AUD/USD outlook shows a sharp rebound in the Australian dollar after a surprise pause by the RBA. Meanwhile,

0
Would love your thoughts, please comment.x
()
x