- The AUD/USD outlook remains favorable amid eased geopolitical concerns.
- The Aussie found support amid weaker USD and upbeat Chinese data.
- Technically, the AUD/USD price finds resistance by 20-SMA and neutral RSI.
The AUD/USD outlook improved slightly on Friday amid upbeat Chinese economic data combined with a pullback in the US dollar. However, the broader market sentiment remains cautious due to escalating geopolitical worries in the Middle East.
-If you are interested in forex day trading then have a read of our guide to getting started-
The Aussie stayed firm after China kept its lending rates unchanged. The People’s Bank of China (PBoC) retained the one-year loan prime rate at 3%, with the five-year rate at 3.5%, as widely expected. The steady response came after China’s retail sales soared to 6.4% y/y in May, beating the estimated 5%. Meanwhile, the industrial production went to 5.8%, slightly below the forecast.
The upside for the Australian dollar is limited due to deteriorating risk sentiment, although the Chinese economic indicators are lending support to the commodity-linked currency. The US dollar has gained traction as the Israel-Iran conflict escalates, weighing on the risk assets.
According to the New York Times, Iran hasn’t committed to developing a nuclear weapon yet. However, the US military action could provoke it. President Trump’s recent statement regarding an offer to assess two weeks eased risk-off pressure on the markets.
Due to this backdrop, the dollar index fell to 98.60, primarily on technical grounds. The Fed’s decision to hold rates steady with a cautious tone about future policy has also capped dollar gains. Fed Chair Powell suggested that the next rate cuts depend on labor market and inflation data.
On the other hand, the Australian domestic employment data came in softer than expected, tempering some of the AUD gains. The unemployment rate held steady at 4.1% as expected, while the employment data showed a decrease of 2,500 jobs in May.
AUD/USD Technical Outlook: SMA, RSI Resisting Gains
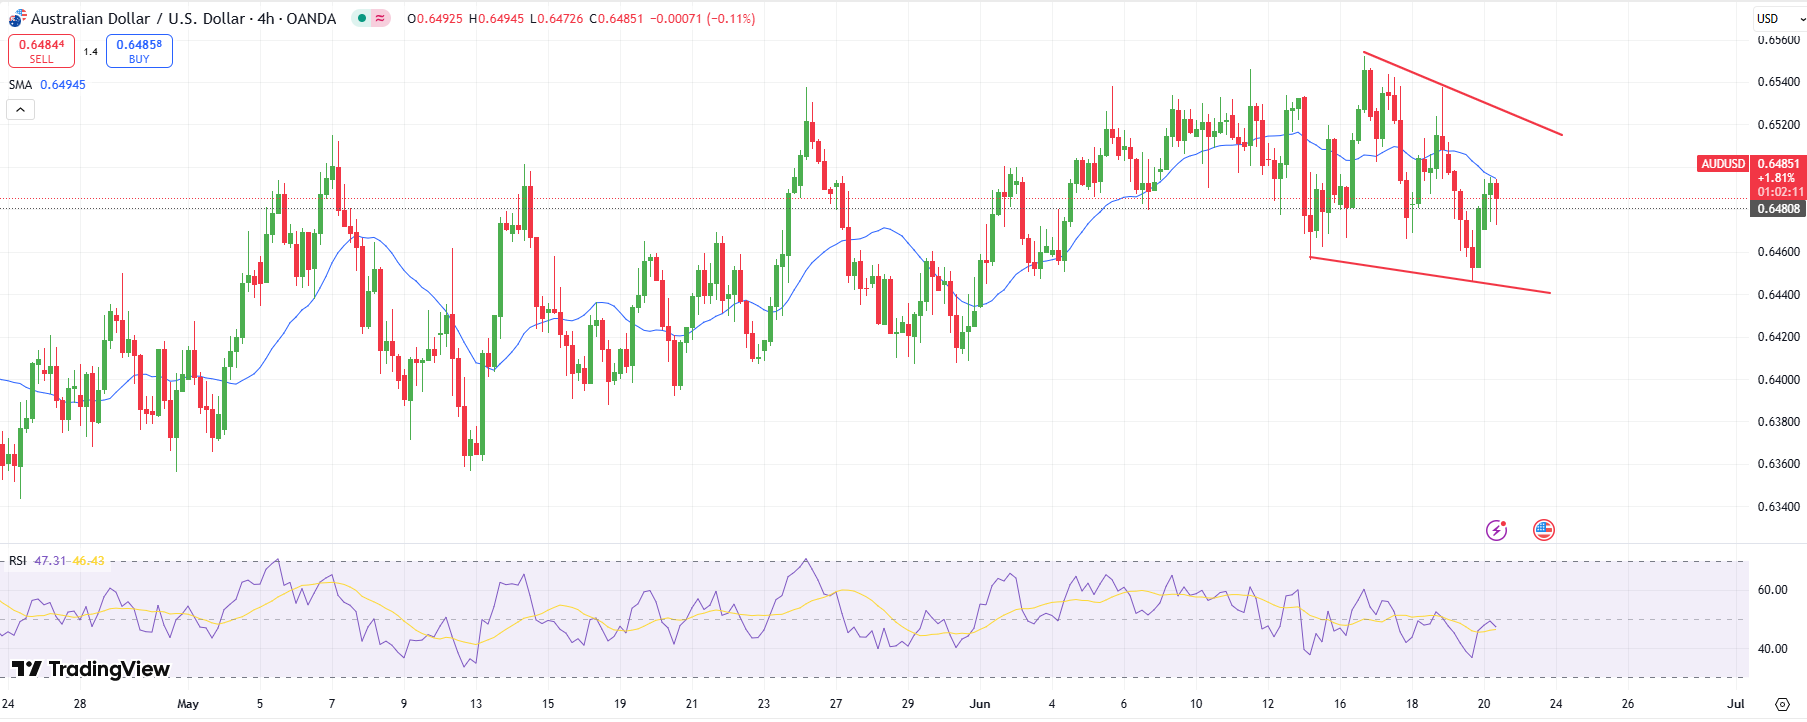
The AUD/USD 4-hour chart shows the price remained capped by the 20-period SMA while staying within the trendlines. The last three candles showed a strong upside move as the price hit the oversold RSI zone. However, the RSI value is now under 50.0, and the price action is subdued as well.
-Are you looking for the best AI Trading Brokers? Check our detailed guide-
The downside seems protected by the 0.6450 area, and staying above the level is a bullish sign. However, breaking the level may lead the price towards 0.6400. On the flip side, 0.6500 could be the key resistance ahead of the 0.6535 level.
Looking to trade forex now? Invest at eToro!
67% of retail investor accounts lose money when trading CFDs with this provider. You should consider whether you can afford to take the high risk of losing your money.