AUD/USD Forex Signal 19/08: Bearish Divergence (Chart)

Bearish view

  • Sell the AUD/USD pair and set a take-profit at 0.6400.
  • Add a stop-loss at 0.6600.
  • Timeline: 1-2 days.

Bullish view

  • Buy the AUD/USD pair and set a take-profit at 0.6600.
  • Add a stop-loss at 0.6400.

AUD/USD Forex Signal 19/08: Bearish Divergence (Chart)

The AUD/USD pair remained flat on Tuesday, marking a fairly quiet week with no major economic events from Australia. It was trading at 0.6500 on Tuesday, a range it has maintained for the past few months.

Jackson Hole Symposium

The AUD/USD exchange rate moved sideways on Tuesday as market participants reacted to last week’s Reserve Bank of Australia (RBA) interest rate decision. In a statement, the bank announced a 0.25% reduction in interest rates, offering relief to households.

Economists expect the bank to cut interest rates at least two more times this year to supercharge the economy. Without the cuts, the bank expects the economy to deteriorate because of the trade war.

The AUD/USD pair will next react to the upcoming US building permits and housing starts data. Data compiled by Reuters is expected to show that the building permits dropped slightly to 1.39 million, while housing starts fell to 1.30 million.

The most important catalyst for the pair will come from the United States where the Federal Reserve will publish minutes of the last monetary policy meeting on Wednesday. These minutes will provide more color on the last meeting and what to expect later this year.

Jerome Powell, the head of the Federal Reserve, will also deliver a closely-watched statement at the annual Jackson Hole Symposium. Fed officials use this meeting to share their outlook on the economy and prepare the market on what to come.

Powell, who is under pressure from Trump, is likely to maintain his hawkish stance due to the recent strong consumer and producer inflation data. The data showed that the headline CPI rose to 2.7%, while the producer price index (PPI) moved to 3.6%.

AUD/USD Technical Analysis

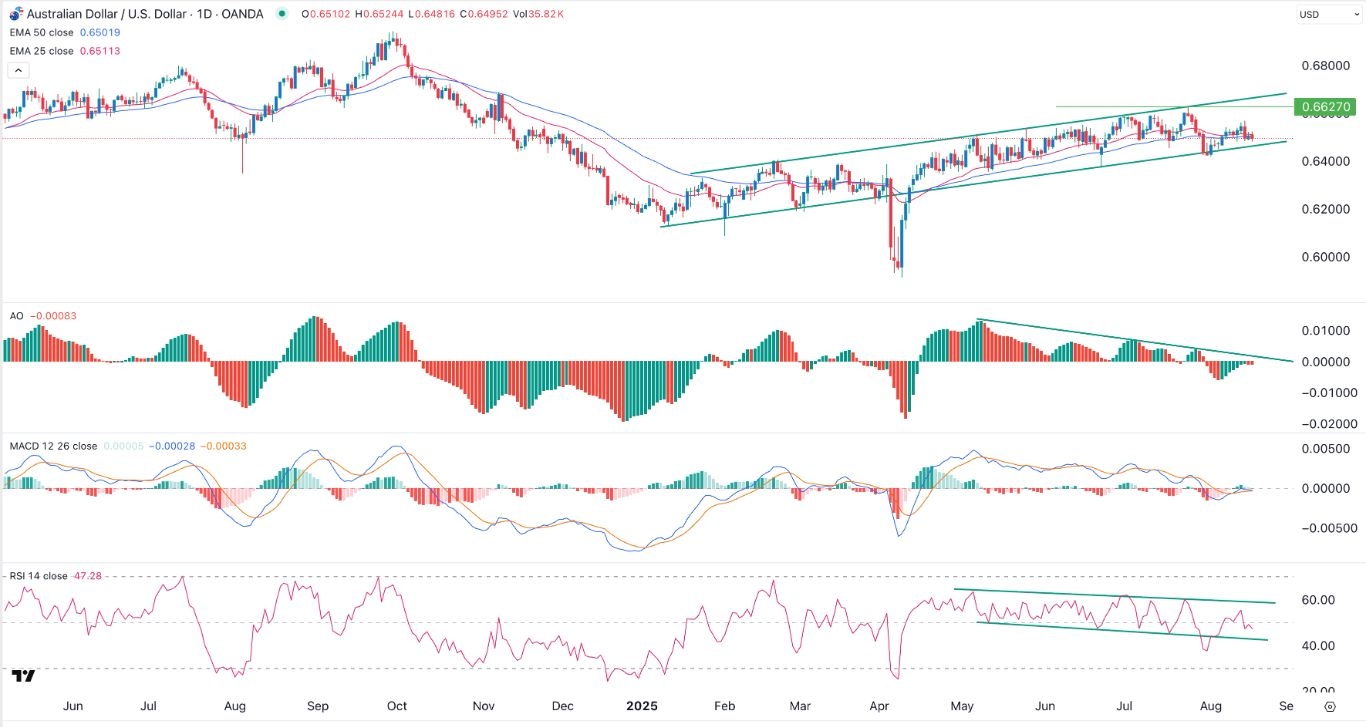
The daily timeframe chart shows that the AUD/USD pair has moved upwards in the past few months. It has formed an ascending channel and is now slightly above the lower side.

The pair is hovering at the 50-day and 25-day moving averages. At the same time, the oscillators point to a bearish divergence pattern, with the Awesome Oscillator, Relative Strength Index (RSI), and the MACD moving downwards.

Therefore, the pair will likely continue falling as sellers target the psychological point at 0.6400. A move above the resistance point at 0.6560 will invalidate the bearish outlook.

Ready to trade our free trading signals? We’ve made a list of the top forex brokers in Australia for you to check out.

Crispus Nyaga is a financial analyst, coach, and trader with more than 8 years in the industry. He has worked for leading companies like ATFX, easyMarkets, and OctaFx. Further, he has published widely in platforms like SeekingAlpha, Investing Cube, Capital.com, and Invezz. In his free time, he likes watching golf and spending time with his wife and child.

Source link

Visited 1 times, 1 visit(s) today

Related Article

A person looks at three different computer screens displaying code and charts.

Prediction: Nvidia Stock Will Jump Higher After Aug. 27

The stock has gone on a parabolic run since hitting a 52-week low in April this year, and it seems primed for more upside following its upcoming earnings report. Nvidia (NVDA -3.47%) stock made a remarkable recovery on the stock market since hitting its 52-week low on April 7, rising an incredible 83% in such

The term

Meet the Monster Stock That’s Crushing Nvidia and Palantir on the Market

This AI infrastructure play has delivered bigger gains than its larger peers since going public earlier this year. Artificial intelligence (AI) supercharged the growth of Nvidia (NVDA -3.47%) and Palantir Technologies (PLTR -9.39%) in the past couple of years or so, and that’s not surprising, as both companies are playing a key role in the

USD/BRL Analysis 20/08: Near-Term Reversal Upwards (Chart)

USD/BRL Analysis 20/08: Near-Term Reversal Upwards (Chart)

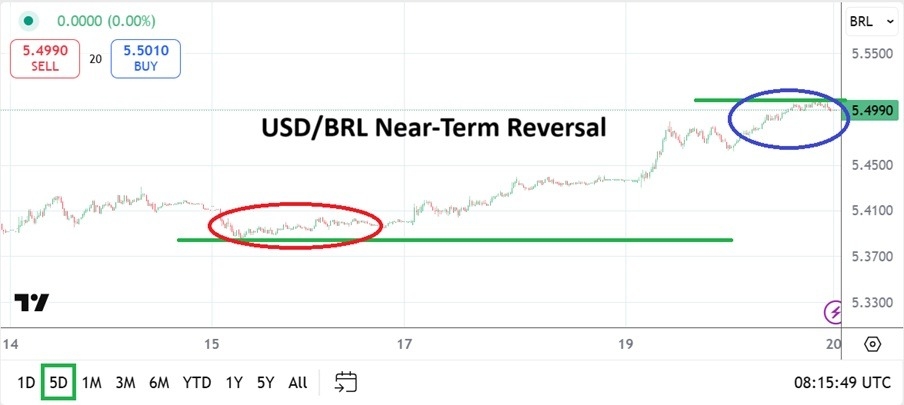
Created on August 20, 2025 The USD/BRL will open its trading within eyesight of 5.5000 today, this after experiencing a buying trend the past handful of days after exploring lows around the 5.3800 realm on Friday. First of all the USD/BRL remains within the lower elements of its long-term technical range. Even the mid-term must

GBP/USD technical price analysis

GBP/USD Price Analysis: Stubborn Inflation to Halt BoE Cuts

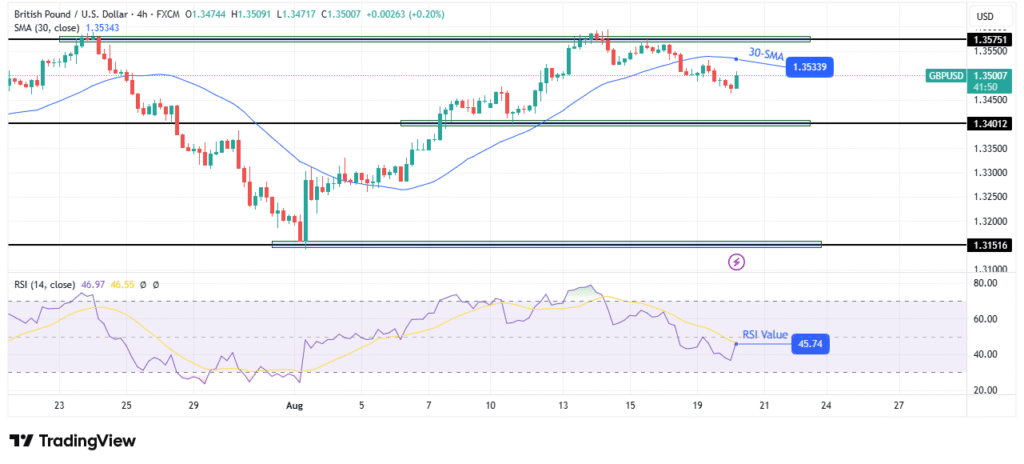
The GBP/USD price analysis suggests a longer delay in Bank of England rate cuts. Inflation in the UK accelerated from 3.6% to 3.8%. Traders are awaiting the FOMC minutes. The GBP/USD price analysis suggests a longer delay in Bank of England rate cuts as UK inflation remains high. As a result, the pound recovered from

OpenAI CEO Sam Altman in Tokyo on February 3, 2025. (Photo: Yuichi Yamazaki/AFP/Getty Images)

Fortune Tech: Tech stocks drop, Sam Altman’s bubble, Meta AI downsize, IPO women

Good morning. And strap in if you own major tech stocks. The tech-heavy Nasdaq closed yesterday down 1.4% in the biggest one-day drop in three weeks. Nvidia dropped 3.5%. Palantir sunk 9.4%. Arm was down 5%. AMD was down 5.4%. The pain wasn’t limited to one exchange or market, either. NYSE-listed Oracle was down 5.9%.

ForexEKO Streamlines Candlestick Trading for Gold

ForexEKO Streamlines Candlestick Trading for Gold

By DailyForex Press Release Created on August 20, 2025 MT4 Expert Advisor for XAU/USD that automates pattern detection and routes decisions through clear, rule-based execution. Limassol, Cyprus – August 2025 – ForexEKO applies a structured, data-driven approach to candlestick trading on gold (XAU/USD). It automates the recognition of key formations and connects them to a

Weakens as Dollar Holds Firm (Video)

Weakens as Dollar Holds Firm (Video)

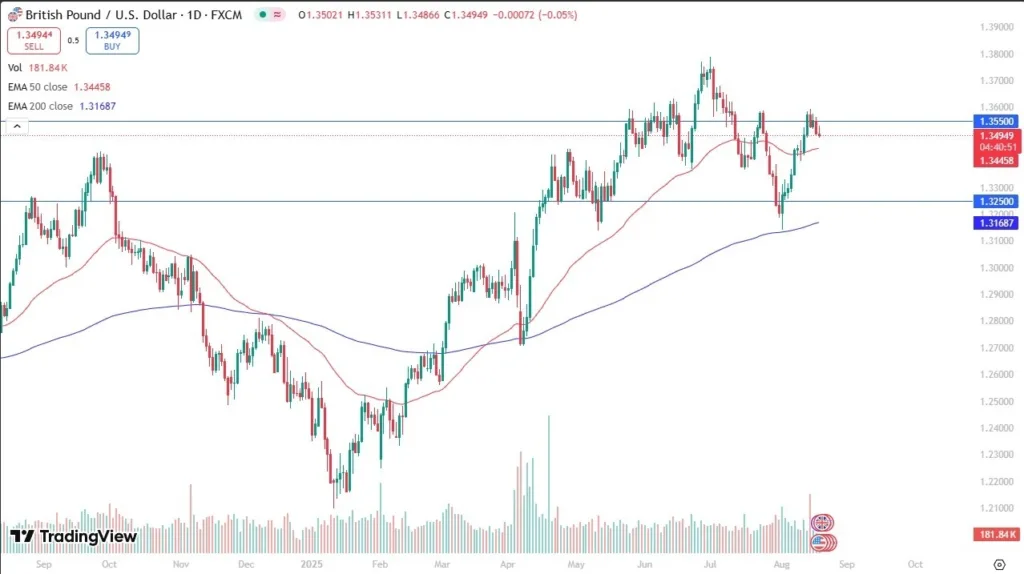
Created on August 20, 2025 The British pound initially trying to rally during the trading session here on Tuesday but has given back those gains pretty quickly. Ultimately, I think you’ve got a scenario where traders are going to look at this through the prism of a potential downtrend tying to form. And I am

Falls as Traders Eye Support (Video)

Falls as Traders Eye Support (Video)

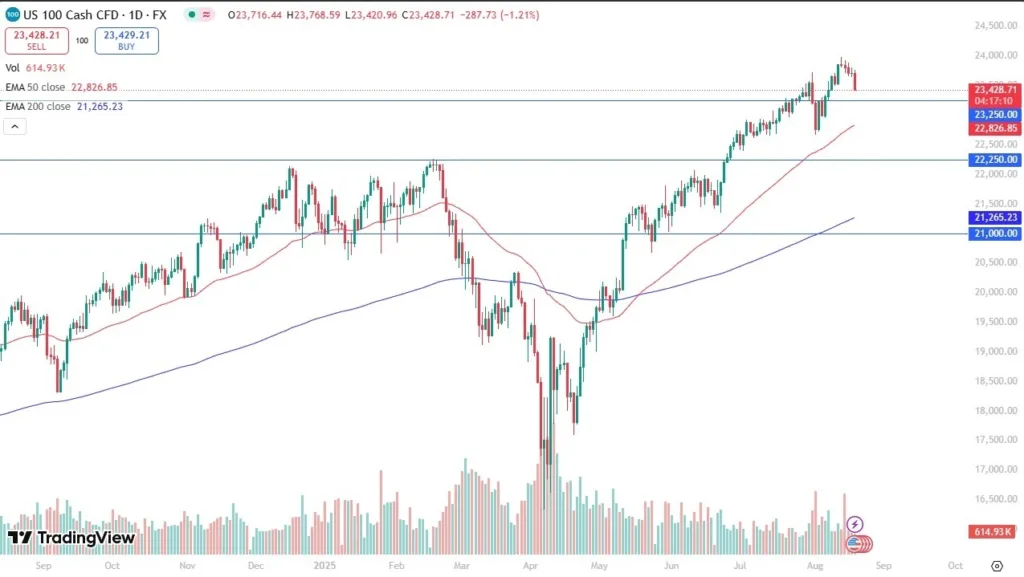
Created on August 20, 2025 You can see that the NASDAQ 100 fell really hard during the trading session here on Tuesday as traders continue to sell off from extreme highs, all things being equal. This is a market that will be looking towards the 23,250 level for some type of support. Traders are looking