AUD/USD Forex Signal 11/08: Bearish Patterns (Chart)

Bearish view

  • Sell the AUD/USD pair and set a take-profit at 0.6425.
  • Add a stop-loss at 0.6650.
  • Timeline: 1-2 days.

Bullish view

  • Buy the AUD/USD pair and set a take-profit at 0.6650.
  • Add a stop-loss at 0.6425.

AUD/USD Forex Signal 11/08: Bearish Patterns (Chart)

The AUD/USD exchange rate rose and retested a crucial resistance level as traders waited for the upcoming Reserve Bank of Australia (RBA) interest rate decision and US consumer inflation numbers. It rose to the key level at 0.6525, a few points above this month’s low of 0.6425.

RBA Decision and US Inflation Data

The AUD/USD pair will be one of the top tokens to watch this week as the RBA concludes its two-day meeting on Tuesday. Economists polled by Reuters believe that the bank will cut interest rates by 0.25% to 3.60% now that inflation is moving in the right direction.

The most recent numbers showed that Australia’s trimmed mean inflation dropped from 3.3% in the first quarter to 2.9% in the second one. Additional data revealed that the broad CPI decreased from 2.4% in Q1 to 2.1%, which is close to the central bank’s target of 2.0%.

Australia’s economy is doing relatively well, helped by higher commodity prices and Chinese demand. The most recent data showed that the GDP grew by 1.3% in the first quarter, a trend that may continue this year.

The bank will also point to Donald Trump’s trade war and its impact to the economy. Australia exported goods worth $40 billion to the United States in 2022, accounting for approximately 5% of its total exports for the year.

The other key AUD/USD news will come from the United States, which will publish the latest consumer inflation data on Tuesday. Economists expect the report to show that the headline CPI rose from 2.7% in June to 2.8% in July, continuing the slow uptrend that started in May.

These numbers come at a time when analysts expect the Federal Reserve to cut interest rates in the upcoming September meeting.

AUD/USD technical analysis

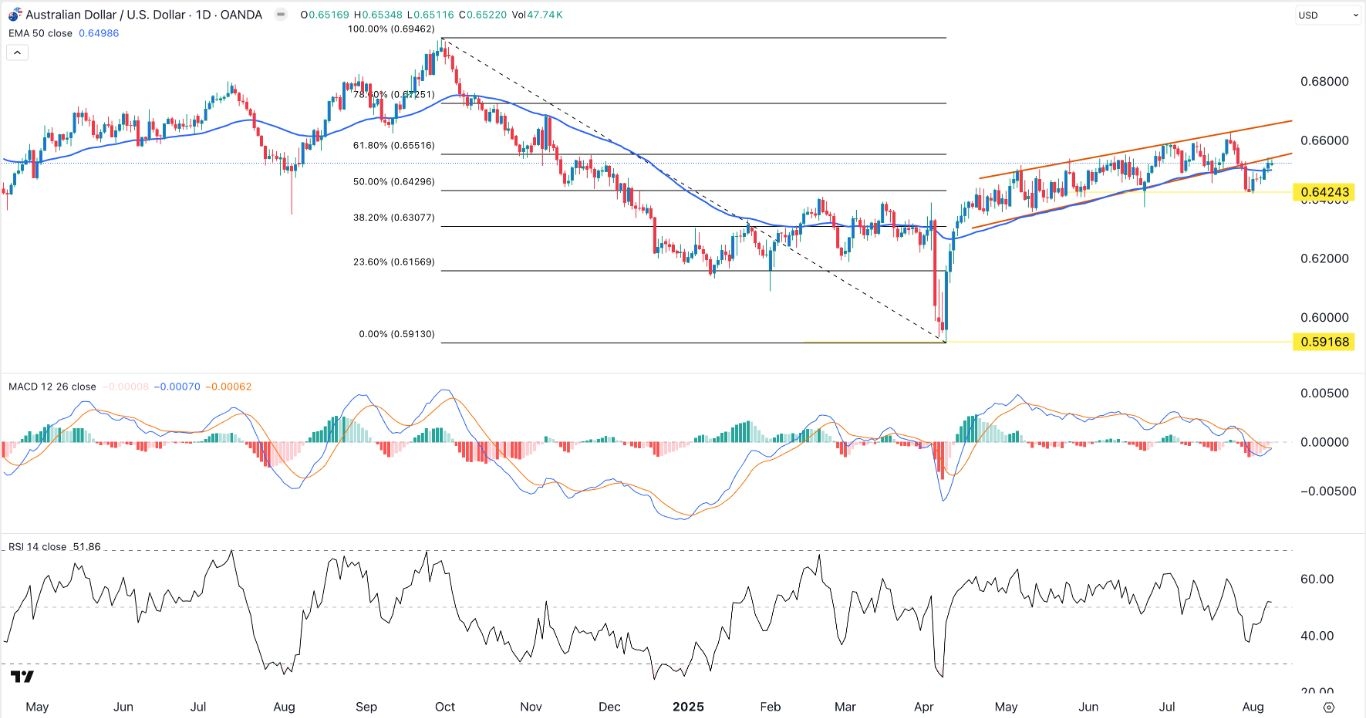
The AUD/USD exchange rate has been in a slow uptrend in the past few days, moving from a low of 0.6425 on August 1 to the current 0.6522. It has retested the lower side of the ascending channel shown in red.

The pair has formed a small bearish flag pattern, while the Relative Strength Index (RSI) and the MACD have formed a bearish divergence.

Therefore, a combination of the bearish flag pattern and the divergence points to more downside. If this happens, it might drop and retest the support at 0.6425.

Ready to trade our free Forex signals? Here are the best forex platforms in Australia to choose from.

Crispus Nyaga is a financial analyst, coach, and trader with more than 8 years in the industry. He has worked for leading companies like ATFX, easyMarkets, and OctaFx. Further, he has published widely in platforms like SeekingAlpha, Investing Cube, Capital.com, and Invezz. In his free time, he likes watching golf and spending time with his wife and child.

Source link

Visited 1 times, 1 visit(s) today

Related Article

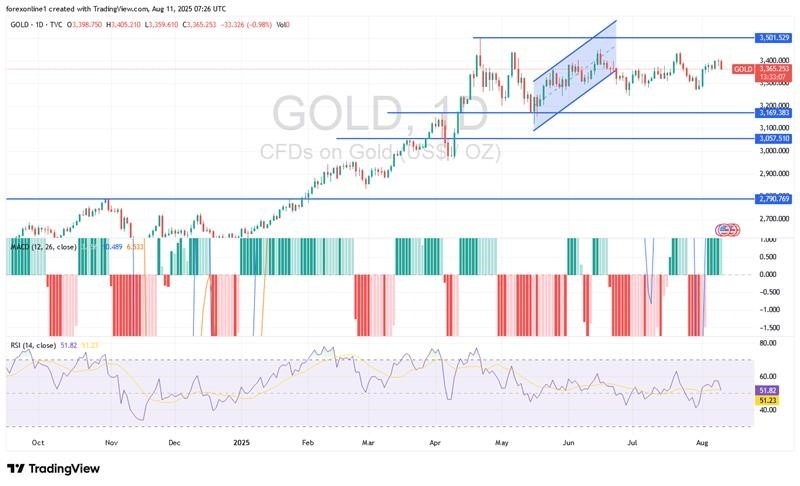
Gold Analysis Today 11/08: Gold Price Is Rising (Chart)

Gold Price Is Rising (Chart)

Created on August 11, 2025 Today’s Gold Analysis Overview: The overall Gold Trend: Strongly bullish. Today’s Gold Support Levels: $3,378 – $3,360 – $3,300 per ounce. Today’s Gold Resistance Levels: $3,415 – $3,440 – $3,480 per ounce. Today’s Gold Trading Signals: Sell gold from the resistance level of $3,435, with a target of $3,320 and

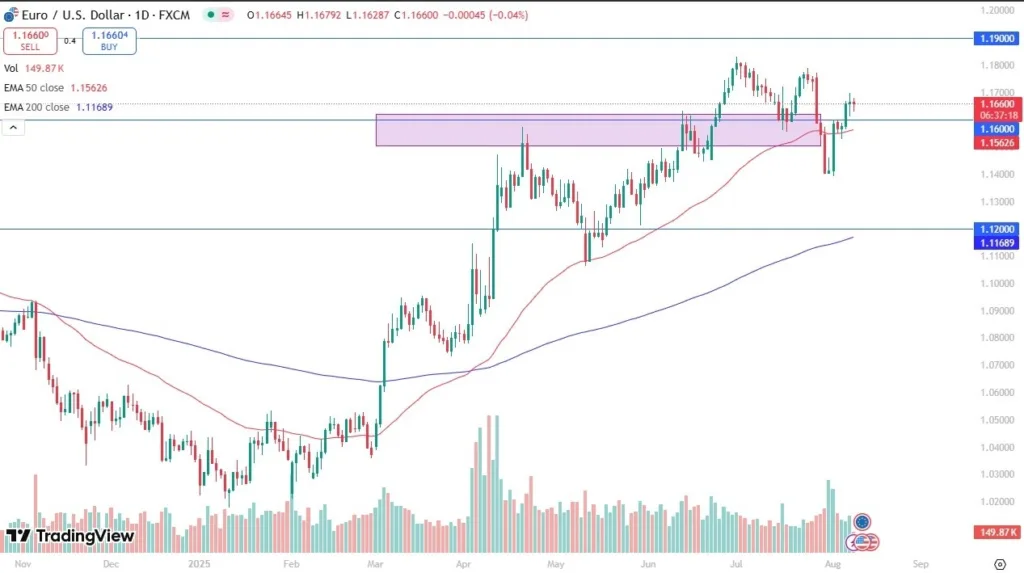
EUR/USD Forecast 11/08: Continues to Consolidate (Chart)

EUR/USD Forecast 11/08: Continues to Consolidate (Chart)

Created on August 11, 2025 The euro has gone back and forth during the trading session on Friday, as we continue to hover just above the 1.16 level. This is a pair that had recently formed a bit of a double top, only to plunge toward the 1.14 level. The 1.14 level is a large,

How to Get Forex Signals for Free in 2025?

How to Get Forex Signals for Free in 2025?

In the fast-paced world of Forex trading, timing and accuracy can make or break your strategy. That’s where live Forex signals come into play. These real-time alerts can guide traders on what to trade, when to enter, and when to exit — even if they don’t have years of technical experience. And the best part?

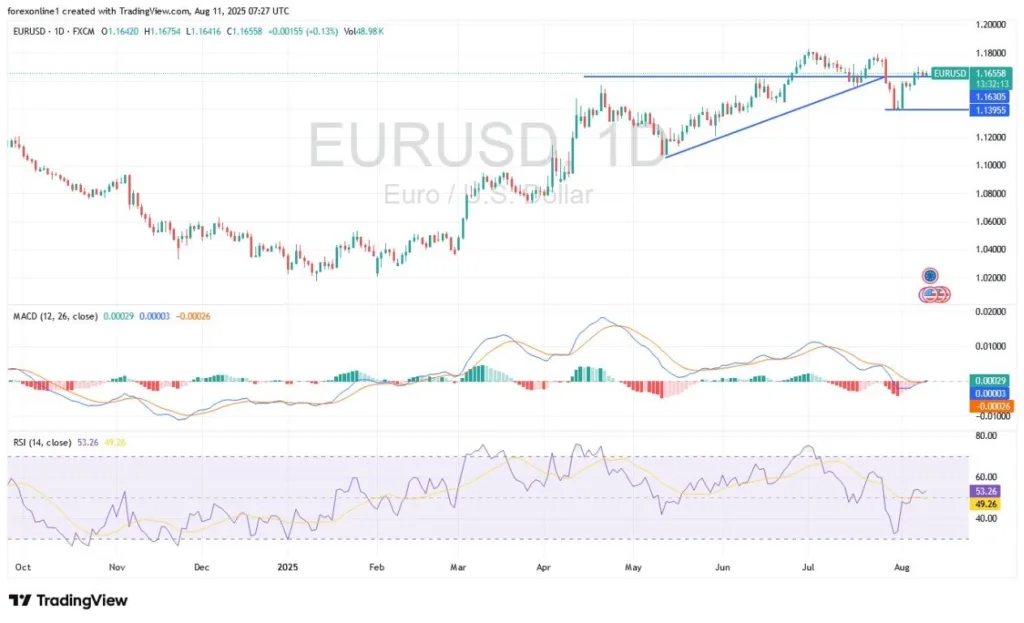
EUR/USD Analysis 11/08: Trading in Narrow Ranges (Chart)

Trading in Narrow Ranges (Chart)

Created on August 11, 2025 EUR/USD Analysis Summary Today Overall Trend: Preparing for an upward shift. Today’s EUR/USD Support Levels: 1.1600 – 1.1550 – 1.1470. Today’s EUR/USD Resistance Levels: 1.1700 – 1.1770 – 1.1860 EUR/USD Trading Signals: Buy EUR/USD from the support level of 1.1560, with a target of 1.1900 and a stop loss of

Nvidia pushes back on accusations its H20 chips pose a national security risk in China

Trump Nvidia, AMD China chip revenue deal implications

Nvidia and AMD have agreed to share some of their revenue from sales to China with the U.S. government, according to several reports, sparking debate about whether the move could impact the chip giants’ business and whether Washington might seek out similar deals. In exchange for 15% of revenues from the chip sales, the two

Nvidia Forex Signal 11/8: Threatens Another Breakout (Chart)

Nvidia Forex Signal 11/8: Threatens Another Breakout (Chart)

Created on August 11, 2025 Potential signal: If NVDA breaks above the $185 level, I’d be aiming for the $197 level. Stop loss at the $175 level. During the trading session on Friday, we have seen Nvidia rally again, as it looks like we are trying to break above the shooting star that formed on

USD/MXN Analysis 11/08: Mid-Term Low Challenged (chart)

USD/MXN Analysis 11/08: Mid-Term Low Challenged (chart)

Created on August 11, 2025 The USD/MXN continues to show a tendency to trend downwards and is near the 18.59800 ratio as of this writing with fast changes in values, this after going into the weekend with its low for the week and within sight of important support levels. After the USD/MXN traversed higher in

USD/JPY technical outlook

USD/JPY Outlook: Caution Builds as US CPI Report Looms

The USD/JPY outlook shows some indecision in the market ahead of the US CPI. Economists are forecasting a US headline figure of 2.8%. Trade tensions between China and the US might increase. The USD/JPY outlook shows some indecision in the market as traders look forward to crucial US inflation figures. Meanwhile, the uncertainty surrounding the