Assessing Novo Nordisk Shares After 61% Fall and New US Patent Challenge in 2025
If you’re eyeing Novo Nordisk stock right now, you’re not alone. Investors have been left scratching their heads as to what comes next, after several twists in the company’s share price. In the past week, shares in Novo Nordisk slipped by 0.5%, following a stronger run over the last month with a climb of 6.9%. Despite these short-term moves, the longer-term performance paints a far more complex story. While the stock is actually up 74.5% over the last five years, the past year has seen a sharp downturn, with shares down 61.0%. Year-to-date, the stock’s value has fallen 45.5%, hinting at a major shift in how the market is assessing the company’s prospects and risk.
This volatility has come as broader markets digest changing news about the pharmaceutical sector. Growing attention to the opportunities in diabetes care and chronic disease treatments has fueled new optimism for many companies in the space, but Novo Nordisk’s stock swings suggest there is still some uncertainty around just how quickly and profitably these opportunities may unfold for the company itself.
Here’s where it gets interesting: when we run Novo Nordisk through six classic valuation checks, it emerges undervalued in five of them, landing a robust value score of 5. That raises the question of how accurate these checks are in capturing the full story behind the company’s price.
Next up, let’s break down exactly how Novo Nordisk measures up across the most widely used valuation methods. And, stick around for the end, where we will introduce an approach that can offer an even sharper perspective on what Novo Nordisk is truly worth.
The Discounted Cash Flow (DCF) model estimates a company’s intrinsic value by projecting its future cash flows and discounting them back to today’s value. This reflects the time value of money and expected business risks. For Novo Nordisk, this method provides insight into forward-looking cash generation and offers an estimate of the company’s underlying worth beyond current market sentiment.
In 2023, Novo Nordisk reported free cash flow of DKK 68.4 billion. Analyst forecasts suggest steady growth, with projections reaching DKK 148.4 billion by 2029. While estimates from analysts extend about five years, longer-term forecasts through 2035 have been modeled by Simply Wall St to capture the company’s full earnings power. Over this period, annual free cash flow is expected to increase at a healthy pace, indicating strong future profitability.
When these projected cash flows are discounted to their present value, the DCF model calculates Novo Nordisk’s intrinsic value at DKK 1,238.86 per share. With the current share price trading almost 71.9% below this estimate, the analysis points to the stock being significantly undervalued by the market, at least on a pure cash flow basis.
Our Discounted Cash Flow (DCF) analysis suggests Novo Nordisk is undervalued by 71.9%. Track this in your watchlist or portfolio, or discover more undervalued stocks.
The Price-to-Earnings (PE) ratio is widely considered one of the most reliable valuation tools for profitable companies like Novo Nordisk. It allows investors to gauge how much the market is willing to pay for each unit of earnings, making it especially useful for established businesses with steady profits.
A company’s PE ratio can vary significantly depending on its growth prospects and the perceived risk of its business. Higher expected earnings growth or lower risk typically justify a higher PE ratio. In contrast, lower growth or greater risk suggest a lower multiple would be appropriate.
Currently, Novo Nordisk trades at a PE ratio of 13.9x. This is significantly below both the Pharmaceuticals industry average of 25.1x and the peer group average of 26.3x. At first glance, this might make Novo Nordisk seem undervalued relative to its industry and similar companies.
However, Simply Wall St’s proprietary “Fair Ratio” provides a more nuanced picture. The Fair Ratio, set at 29.8x for Novo Nordisk, takes into account multiple factors beyond simple comparisons, such as the company’s forward earnings growth, profit margins, industry dynamics, market size, and specific risks. This approach avoids the pitfalls of using generic averages by assessing what investors should reasonably expect to pay for Novo Nordisk’s earnings given its unique profile.
Comparing Novo Nordisk’s current PE ratio of 13.9x to the Fair Ratio of 29.8x, the stock appears noticeably undervalued on this metric. This suggests there may be meaningful upside if market expectations adjust.
Earlier, we mentioned there is an even better way to understand valuation, so let’s introduce you to Narratives. A Narrative is a simple, interactive way to bring your personal perspective to life, letting you tell the story you believe about a company by using your chosen assumptions about its future growth, profitability, and risks, and then seeing how this outlook shapes a fair value.
With Narratives, you connect Novo Nordisk’s story directly to a financial forecast and then to an estimate of what the shares should be worth, all in one seamless flow. This tool is readily accessible on Simply Wall St’s Community page, used by millions of investors, and makes it easy for anyone, regardless of experience, to build, adjust, and visualize their investment thinking in real time.
Narratives empower you to decide when to buy or sell by comparing your Fair Value to the current price. Since these Narratives update automatically with new data or major news, you always have a living reflection of your evolving outlook.
For Novo Nordisk, for example, some investors anticipate explosive growth and estimate a Fair Value above DKK 1,000, while others focus on competitive risks and set a fair value closer to DKK 340. This shows how different stories behind the numbers can lead to very different investment decisions.
This article by Simply Wall St is general in nature. We provide commentary based on historical data and analyst forecasts only using an unbiased methodology and our articles are not intended to be financial advice. It does not constitute a recommendation to buy or sell any stock, and does not take account of your objectives, or your financial situation. We aim to bring you long-term focused analysis driven by fundamental data. Note that our analysis may not factor in the latest price-sensitive company announcements or qualitative material. Simply Wall St has no position in any stocks mentioned.
Companies discussed in this article include NOVO B.cpse.
The stock market’s leading artificial intelligence (AI) stocks are giving investors a clear reason to be cautious. For the better part of the last three years, artificial intelligence (AI) has been the grease that’s lubed Wall Street’s finely tuned engine. Empowering software and systems with AI solutions offers the potential to improve productivity and/or operating
One of the biggest strengths of MT4 was its ability to give traders a clearer view of the global market’s rhythm. The forex market never sleeps, but liquidity and volatility change throughout the day depending on which financial centers are open. By default, MT4 allowed customization of charts so traders could track trading sessions forex
Hedge fund manager Philippe Laffont recently trimmed his stake in Meta Platforms and bought stock in The Trade Desk. Billionaire Philippe Laffont is the founder and portfolio manager at Coatue Management, a hedge fund that nearly tripled the returns of the S&P 500 (^GSPC -0.05%) in the last three years. That makes him a good
These stocks are up for the year, and the upward momentum is unlikely to stop. The indexes are at all-time highs, which is good news for shareholders. Since record highs tend to inspire more buying, the bull market could continue. One drawback of bull markets is that they tend to leave bargain-hunting investors with few
Shopify stock has massively outperformed the S&P 500 over the last three years — can it keep beating the market? One path to successful investing is beating the market. Granted, it’s easier said than done, but it is possible. Today, let’s take a look at one stock that has been doing just that: Shopify (SHOP
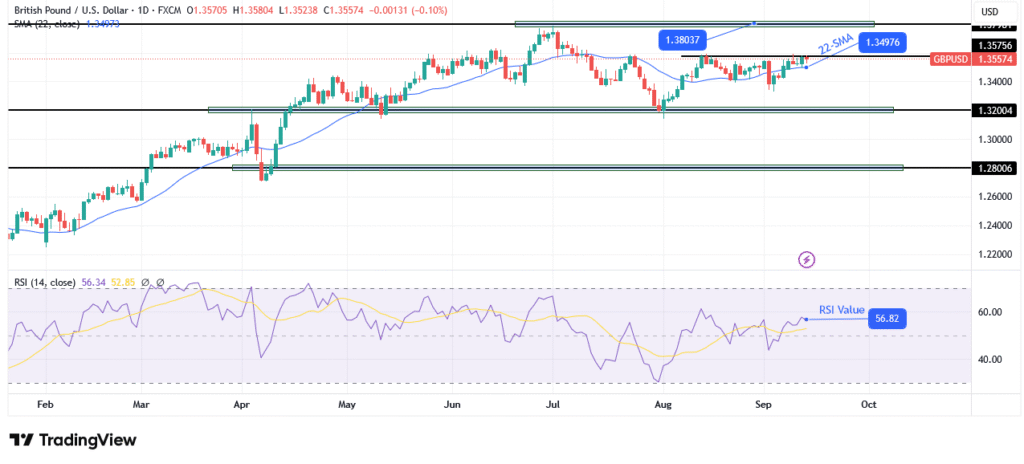
The GBP/USD weekly forecast suggests further upside for the pound. The US CPI report revealed that inflation accelerated from 0.3% to 0.4%. US unemployment claims were higher than expected, supporting Fed rate cut bets. The GBP/USD weekly forecast suggests further upside for the pound as traders gear up for a Fed rate cut on Wednesday.
Traders work on the floor of the American Stock Exchange. (Bloomberg) — A $14 trillion rally that has taken stocks to record highs is heading for an inflection point next week, with investors expecting the Federal Reserve to resume cutting interest rates at its long-awaited monetary policy meeting. Most Read from Bloomberg The S&P 500
Nokia Oyj (HLSE:NOKIA) has caught the attention of investors this week, after a swing in its share price that could be prompting questions about what’s really driving the move. While there’s no single event making headlines, sometimes these quieter shifts are the ones that matter, especially for investors weighing their next step. Looking at the