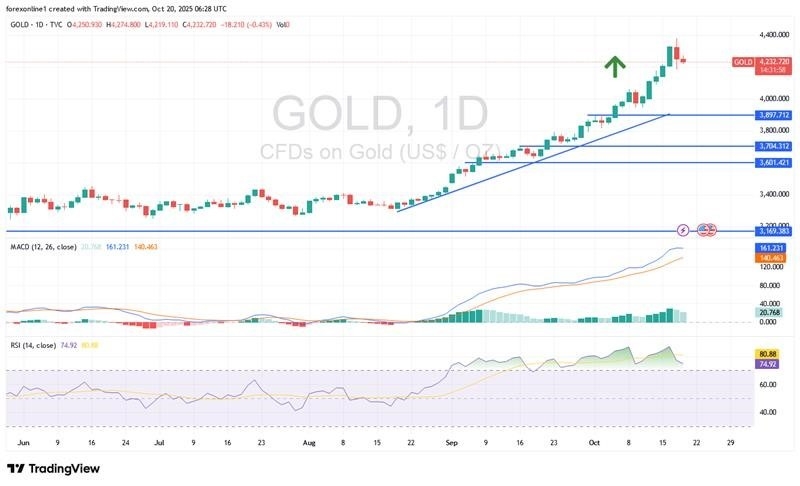

Gold markets have rallied quite nicely during the trading week, as we are threatening to break far above the $3800 level. A short-term pullback at this point in time would make a certain amount of sense as we have seen green candles print for 6 weeks in a row now. That being said, any pullback at this point in time will more likely than not end up finding buyers near the $3700 level, assuming that we can even drop that far. Gold is explosive in its momentum but eventually will have to reach lower prices to attract new buyers.

Bitcoin has fallen rather hard during the course of the trading week, as we continue to threaten the $110,000 support level, an area that previously had been resistance as well as support. We are just a little bit below that level at this point, but there is a “zone of support and resistance” meaning that the $107,000 level underneath current trading also offers a certain amount of support. Ultimately, this is a market that is still in an uptrend, but it obviously is struggling to find some type of momentum. That could end up being a bit of a problem and it would not surprise me at all to see this market break down to the $100,000 level, or we now find the 50 Week EMA. On the other hand, if we rally it’s likely that we will try to challenge the $117,000 level.

Silver has had another explosive week as we continue to see a lot of noisy behavior overall. That being said, the market is likely to see a certain amount of exhaustion sooner or later, because quite frankly this is a market that will continue to be very interesting, but as we have gained roughly 12% in just a few short weeks, sooner or later gravity comes back into the picture. Any pullback at this point in time should be thought of as a potential buying opportunity, but I also recognize that shorting this market would be very difficult to do, and therefore a little bit of patience probably goes a long way.

The US dollar has rallied a bit during the course of the week, breaking above the ¥149 level. This is a breach of the major consolidation area that we have been in for a couple of months now, and as a result it looks like we are going to continue to see a lot of noise, but I do think it is probably only a matter of time before we test the crucial ¥151 level, the top of a major shooting star from about 2 and half weeks ago. If we can break above that candlestick, then it’s likely that the market could go looking to the ¥156 level. Short-term pullbacks are possible, and they will continue to offer value, but if we were to break down below the ¥146 level, then things will get negative.

The US dollar has been back and forth during the previous week, as we continue to see the US dollar try to put in some type of bottom against the Swiss franc in general. The 0.79 level continues to be a major support level, but it’s also noting that the 0.80 level above offers resistance, just as the 0.81 level does. Because of this, the markets are likely to continue to see a lot of choppiness and sideways trading in this general vicinity. Keep in mind that this pair has been sideways for 2 months, and it doesn’t look like it changes anytime soon.

The US dollar has been all over the place against the Mexican peso during the week, which is probably not a huge surprise considering that the previous week ended up forming a massive hammer. If we were to break down below the hammer from the previous week, it more likely than not opens up the possibility of the US dollar dropping down to the 18 MXN level. On the other hand, if we do rally from here, then the 18.80 MXN level might be targeted, but that’s essentially “swimming upstream.”

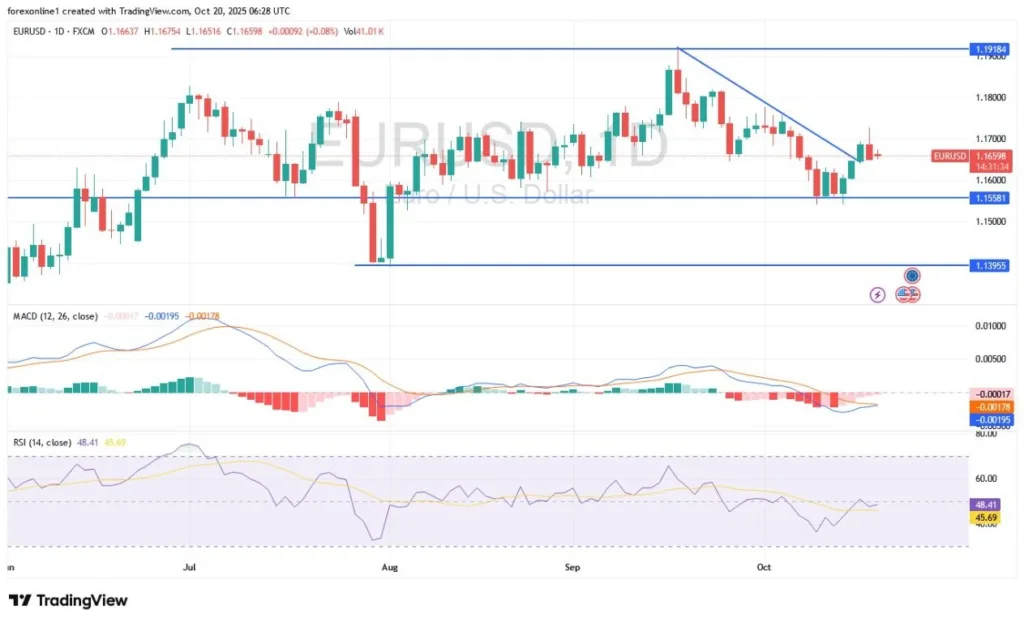
The euro has been a bit negative this week, but it’s also worth noting that we have been all over the place. We broke above the 1.18 level, only to turn around and collapse toward the 1.1650 level. Ultimately, we are still very much in a sideways market that has a floor at the 1.16 level, and a ceiling at the 1.18 level, and I don’t know if it changes quite yet. However, if we can break out of this 200 pip range, then we could get a clear sign as to which direction we will be moving.

The British pound has been all over the place during the week but looks as if it is going to settle near the 1.34 level. The 1.34 level has been both support and resistance multiple times, and a bit of a magnet for price. Ultimately, we are in a 400 pip range, with the 1.32 level being the massive floor in the market, the 1.36 level being the massive ceiling. As we are basically in the middle of this range, this pair is more likely than not going to remain somewhat neutral in the short term.
Ready to trade our Forex weekly forecast? We’ve shortlisted the best forex trading accounts to choose from.