Is There Now an Opportunity in Kenvue After Latest 20% Share Price Drop?
If you are trying to figure out whether to hold onto your Kenvue shares, add more to your portfolio, or sit this one out, you are definitely not alone. Investors have watched Kenvue’s stock price take a hit lately, dipping 4.9% in the past week and slipping more than 20% over the last month. It has been a rough ride for the stock so far this year, with shares down 19% year-to-date and over 22% compared to this time last year. Those numbers might seem troubling at first glance, but a deeper look suggests there might be more to the story.
Behind Kenvue’s rocky performance are several market factors. Shifting investor sentiment toward consumer health names, as well as sector-wide uncertainties, have weighed down the stock. Sometimes, as is clear here, the mood of the market can be just as important as company-specific news. However, numbers on paper still matter, and from a valuation perspective, Kenvue is starting to look quite interesting for value hunters.
Right now, Kenvue earns a valuation score of 5 out of 6 based on six key checks for undervaluation. That means the company looks attractively priced in the vast majority of ways analysts measure whether a stock might be a bargain.
If you are curious about how that score was calculated, you are in the right place. We are about to break down the different valuation methods one by one. Stick around, because at the end we will introduce an even better way to think about finding true value.
The Discounted Cash Flow (DCF) model is a method that forecasts a company’s future cash flows and discounts them back to today’s value. This helps estimate what the business is fundamentally worth, based on the cash it is expected to generate over time. DCF is a favorite among value investors because it puts cash generation front and center.
For Kenvue, the DCF model uses recent and projected cash flows. Over the last twelve months, Kenvue produced $1.6 billion in free cash flow. According to analyst estimates, annual free cash flow is expected to grow, reaching $2.8 billion by 2029. Further into the future, projections show free cash flow approaching $3.6 billion by 2035, with near-term estimates guided by analysts and later years extrapolated using long-term forecast trends.
All these future values are then discounted to reflect today’s dollar value. This results in an estimated fair value of $26.48 per share, suggesting Kenvue shares are trading at about a 34.9% discount to their intrinsic value. In summary, the DCF model indicates that the stock is significantly undervalued at current prices.
Our Discounted Cash Flow (DCF) analysis suggests Kenvue is undervalued by 34.9%. Track this in your watchlist or portfolio, or discover more undervalued stocks.
The Price-to-Earnings (PE) ratio is often the go-to metric for valuing profitable companies like Kenvue, because it links a company’s current share price to its per-share earnings. For companies with solid profits, the PE ratio helps investors quickly assess how much they are paying for each dollar of earnings the business generates.
It is important to note, however, that not every PE ratio tells the whole story. Higher ratios can be justified by strong future growth or lower risk. Lower ratios might signal slower growth or greater uncertainty. In other words, the “right” PE for a stock depends on how fast it is likely to grow and how reliable its earnings are.
Currently, Kenvue trades at a PE ratio of 23.33x. For context, the industry average is 23.33x and the average among its closest peers is 38.50x. While this looks reasonable, superficial comparisons can be misleading if they do not account for important differences in business quality, growth rates, and risk factors.
This is where Simply Wall St’s Fair Ratio comes in. The Fair Ratio, which is 25.11x in Kenvue’s case, is calculated using a blend of factors including expected earnings growth, profit margins, company size, risk profile, and industry characteristics. This approach adjusts expectations to better reflect what Kenvue should be worth based on its own strengths and challenges, rather than just stacking it up against the average competitor.
When we compare Kenvue’s actual PE of 23.33x with the Fair Ratio of 25.11x, the numbers are almost in line. This suggests that Kenvue’s current share price closely matches what would be considered fair value based on fundamental drivers.
Earlier we mentioned that there is an even better way to understand valuation, so let’s introduce you to Narratives. In simple terms, a Narrative is your story about a company: you decide what you expect for things like future revenue, earnings, and margins, and then see what those expectations mean for fair value. This approach turns the numbers into a personal investment thesis.
Narratives connect your perspective on Kenvue’s future to a transparent financial forecast, and directly link it to an estimated fair value. This approach is simple and accessible on Simply Wall St’s Community page, where millions of investors share and compare their own Narratives for companies they follow.
By using Narratives, you can easily see how your expectations stack up against Kenvue’s current share price, helping decide whether it may be time to buy, hold, or sell. In addition, all Narratives are updated automatically as new information comes in, such as earnings releases or key news events, so your valuations always reflect the latest facts.
For example, some investors believe Kenvue’s ability to innovate and expand globally supports a fair value near $25, while others cite legal risks and see a more cautious estimate closer to $19. The power of Narratives lies in helping you form and test your own investment view, rather than just relying on a single analyst target.
This article by Simply Wall St is general in nature. We provide commentary based on historical data and analyst forecasts only using an unbiased methodology and our articles are not intended to be financial advice. It does not constitute a recommendation to buy or sell any stock, and does not take account of your objectives, or your financial situation. We aim to bring you long-term focused analysis driven by fundamental data. Note that our analysis may not factor in the latest price-sensitive company announcements or qualitative material. Simply Wall St has no position in any stocks mentioned.
Categorised: The Stream | Tags: algo trading, corporate bonds, HSBC, IBM, quantum computing, RFQsPosted by Colin Lambert. Last updated: September 26, 2025 While some question any potential role of quantum computing in trading (at least for five or more years, according to panellists at this year’s Full FX Scandinavian conference), HSBC and IBM have collaborated
A professional bull got even more bullish on the company’s future. A generous price target increase by an analyst was the development driving up the value of Kratos Defense & Security Solutions‘ (KTOS 3.54%) equity as the trading week neared its end on Thursday. The company’s share price enjoyed a healthy lift of nearly 4%
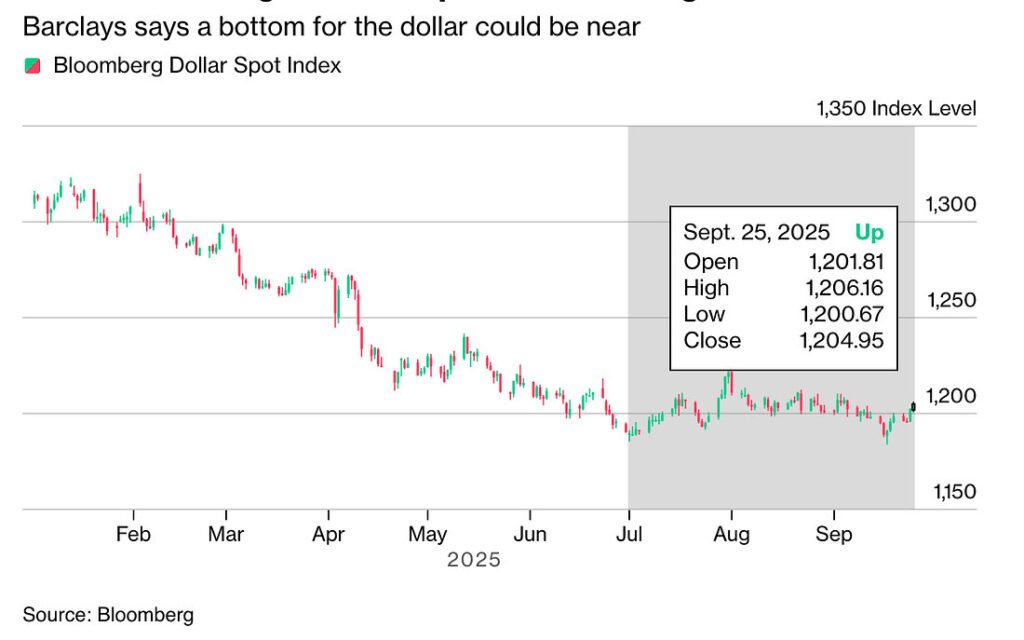
In markets, there are always monsters in the dark—some real, some stitched together by imagination and fear. Right now, many currency traders appear to have been spooked by the spectre of the Federal Reserve losing its independence, haunted by talk of political meddling and looming economic weakness due to White House polices. These ghosts of
The record-setting rally in stocks is stumbling this week. US stocks dropped on Thursday as traders took in strong economic data, revised their expectations for Fed rate cuts, and took in wearing momentum in the AI trade. All three major US indexes slipped lower in the early morning, putting them on track for their third
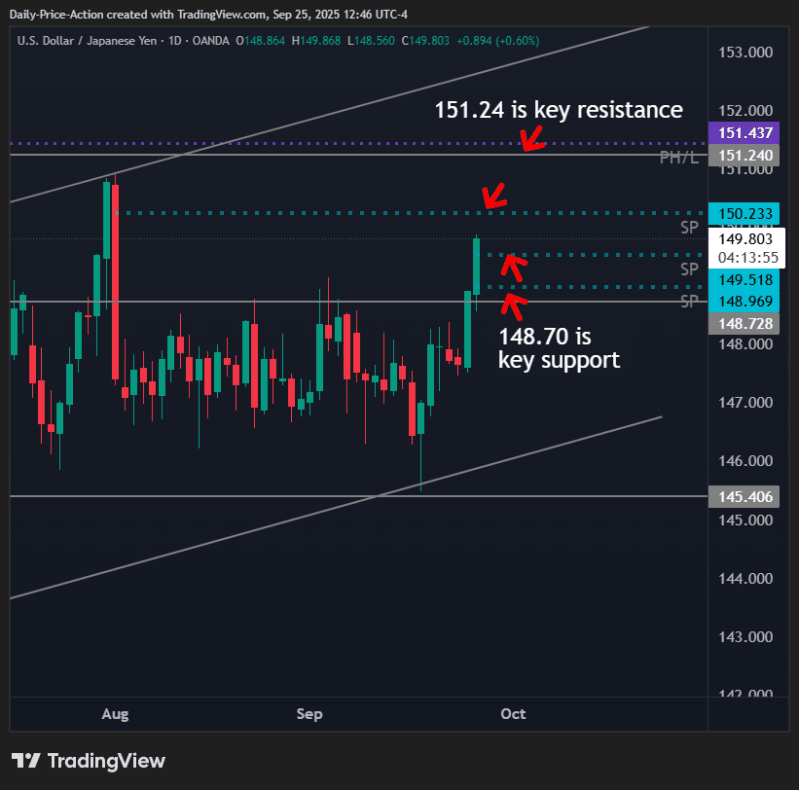
Is USDJPY about to rally 400 pips? Watch today’s video for the details, including key levels, a Time Price Opportunity (TPO) analysis, and targets. I also share the latest on the DXY and Japanese yen basket, so you have a complete USDJPY trade plan. USDJPY is breaking out this week after two months of sideways
There’s an opportunity to get in on the weight-loss drug craze at a reasonable price. Remember Pfizer (PFE -1.68%), the giant pharmaceutical company that developed a COVID-19 vaccine within weeks of the pandemic hitting U.S. shores and got it approved within a year? It was the fastest vaccine development in history and a miracle of
By Niket Nishant and Sukriti Gupta Wall Street’s main indexes were set to open lower on Thursday, as fresh economic data and remarks from a Federal Reserve official tempered optimism around further rate cuts. The moves reflect a broader sense of caution ahead of Friday’s release of the Personal Consumption Expenditures index, the Federal Reserve’s
US stocks fell Thursday as Wall Street assessed an unexpected decline in jobless claims, complicating the calculus for interest rate cuts amid uncertainty about Federal Reserve unity on policy. The Dow Jones Industrial Average (^DJI) dipped about 0.3%, and the S&P 500 (^GSPC) lost 0.6%. Meanwhile, the tech-heavy Nasdaq Composite (^IXIC) fell 0.9%. The declines