AUD/USD Forecast Extends Losses as Traders Await Jackson Hole

  • AUD/USD forecast remains subdued amid sour risk sentiment.
  • Fed meeting minutes show no hint of aggressive easing.
  • Australian PMI data shows a surge in economic activity

The AUD/USD forecast remains bearish on Thursday as the pair slides to 0.6420 during the European session. The price stays around the weakest level in two months after posting four consecutive days of losses. The risk sentiment remains fragile ahead of Fed Chair Powell’s speech at the Jackson Hole Symposium.

Are you interested to learn more about forex options trading? Check our detailed guide-

The market participants are closely watching the annual event, which is expected to provide critical guidance on the Fed’s September policy decision. Traders anticipate a 25 bps rate cut, which would be the first rate cut of 2025, lowering the benchmark rate from 4.25% to 4.0%. The Fed’s stance came under intense criticism as US President Trump urged a deeper cut to as low as 1%. He argued that elevated rates are weighing on the government debt servicing and housing demand.

Recent US data reveals a mixed picture. The US inflation rose to 2.7% in July, with core inflation surging to 3.1% while producer prices went up to 3.6%. Meanwhile, the labor market showed softness, reinforcing the uncertainty around the Fed’s policy. FOMC meeting minutes for July revealed that most of the Fed officials were concerned about the rising inflation and trade tariffs, shedding off bets for aggressive easing.

On the Australian side, preliminary August PMI data showed resilience, with the Composite PMI rising to 54.9 from 53.8 in July—stronger activity in both manufacturing and services. However, failed to shield the Aussie from broad USD strength and risk-off flows.

Key Events for AUD/USD

Looking ahead, traders will closely monitor the release of US flash PMIs and the Philadelphia Fed Manufacturing Index later today. Still, Powell’s Jackson Hole remarks are likely to set the tone for AUD/USD, determining whether the pair extends losses or finds near-term support.

AUD/USD technical forecast: Bears aiming for 200-MA

AUD/USD technical forecastAUD/USD technical forecast
AUD/USD 4-hour chart

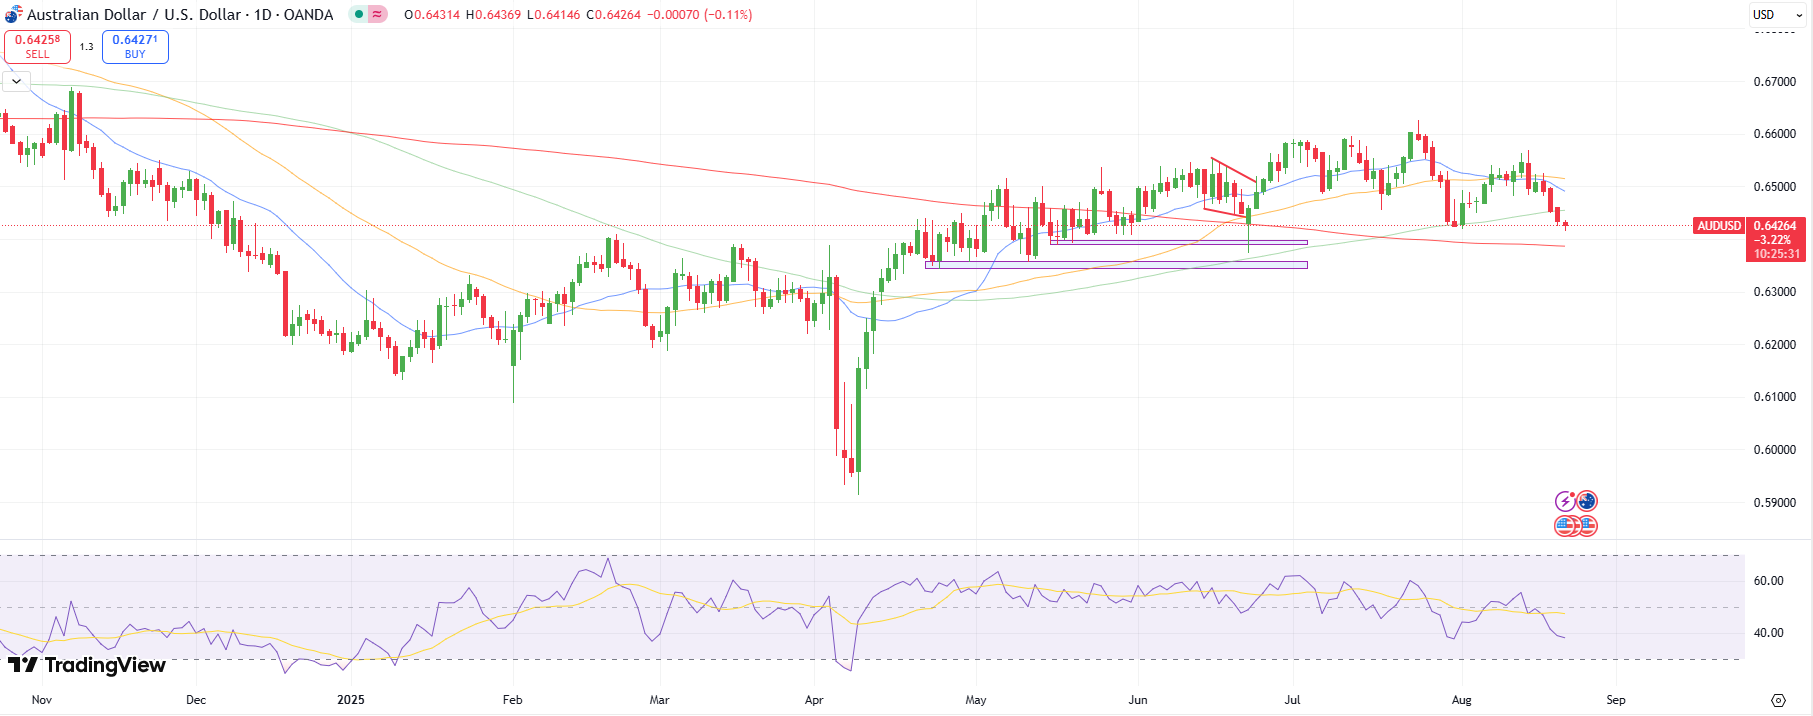
The AUD/USD 4-hour chart shows the price is weak near the key support at 0.6420. In case of a breakout, the pair could extend losses further to test the 200-period MA at 0.6380. Below the level could further attract selling towards 0.6300. The RSI staying under 40.0 shows a solid bearish trend, with more cushion to the downside as the index is still above the oversold zone.

Are you interested to learn more about forex tools? Check our detailed guide-

On the flip side, moving above the 20-period SMA at 0.6490 could shift the trend to the upside with an immediate hurdle at 0.6550 ahead of 0.6600.

Looking to trade forex now? Invest at eToro!

67% of retail investor accounts lose money when trading CFDs with this provider. You should consider whether you can afford to take the high risk of losing your money.

Source link

Visited 1 times, 1 visit(s) today

Related Article

Jerome Powell is set to deliver a speech with high stakes : NPR

In his last Jackson Hole address as Federal Reserve chairman Friday, Jerome Powell will address the economic outlook and the Fed’s long-term balancing act between fighting inflation and unemployment. The speech comes as the central bank is under mounting pressure from the White House to lower interest rates. Kent Nishimura/Getty Images North America hide caption

Stock Market Outlook: Powell's Speech Could Be a Catalyst for This Sector

Stock Market Outlook: Powell’s Speech Could Be a Catalyst for This Sector

A sell-off in high-flying growth stocks this week hints at nervousness ahead of Jerome Powell’s remarks at Jackson Hole, but there’s another area of the stock market where investors should be prepared to see outsize swings after the Fed chief speaks on Friday. Analysts at Bank of America wrote this week that small-caps are likely

News Update – Pre-Markets

5 things to know before the stock market opens Thursday

Here are five key things investors need to know to start the trading day: 1. Shake it off Tariffs aren’t stopping Walmart. The U.S.’ largest grocer and private employer hiked its full-year outlook for earnings and sales on Thursday, even as levies push up costs. The Arkansas-based retailer beat Wall Street’s expectations for second-quarter revenue,

Sebi plans pre-IPO trading platform; mulls longer tenure for equity derivatives, aims to curb grey market risks

Sebi plans pre-IPO trading platform; mulls longer tenure for equity derivatives, aims to curb grey market risks

Markets regulator Sebi chief Tuhin Kanta Pandey on Thursday said the watchdog is exploring a regulated platform for pre-IPO (initial public offering) trading, which could eventually replace unregulated grey market deals. The move, if implemented, may allow investors to trade shares in a transparent environment during the three-day gap between allotment and listing.Speaking at the

Paula Comings: Human Edge in a Digital FX World

Paula Comings: Human Edge in a Digital FX World

With over 20 years of experience across institutions including Goldman Sachs, Deutsche Bank, and now Head of FX Sales at U.S. Bank, Paula Comings aims to bring a thoughtful and client-focused approach to foreign exchange. In this interview with Traders Magazine, she shares her strategic priorities, insights on how the FX landscape is changing, the

EUR/USD Analysis 21/08: Key Economic Readings (Chart)

EUR/USD Analysis 21/08: Key Economic Readings (Chart)

Created on August 21, 2025 EUR/USD Analysis Summary Today Overall Trend: Neutral with a downward bias. Today’s Support Levels: 1.1600 – 1.1550 – 1.1480. Today’s Resistance Levels: 1.1680 – 1.1730 – 1.1800. EUR/USD Trading Signals: Buy EUR/USD from the 1.1560 support level, with a target of 1.1800 and a stop-loss at 1.1500. Sell EUR/USD from

Goldman Traders Say It’s Time to Buy the Dip in Momentum Stocks

(Bloomberg) — Sharp losses in high-flying momentum stocks may present a dip-buying opportunity if history is any guide, according to Goldman Sachs Group Inc.’s trading desk. The traders cited rebounds after similar prior losses in Goldman’s High Beta Momentum basket, coupled with the current technical setup. Most Read from Bloomberg When the long-short momentum basket

Gold Analysis 21/08: USD Recovery Increases Losses (Chart)

USD Recovery Increases Losses (Chart)

Created on August 21, 2025 Today’s Gold Analysis Overview: The overall Gold Trend: Neutral with a downward bias. Gold Support Levels Today: $3310 – $3270 – $3220 per ounce. Gold Resistance Levels Today: $3360 – $3350 – $3410 per ounce. Today’s Gold Trading Signals: Buy gold from the $3290 support level, with a target of