USD/ILS Analysis 21/08: Climb Up Develops (Chart)

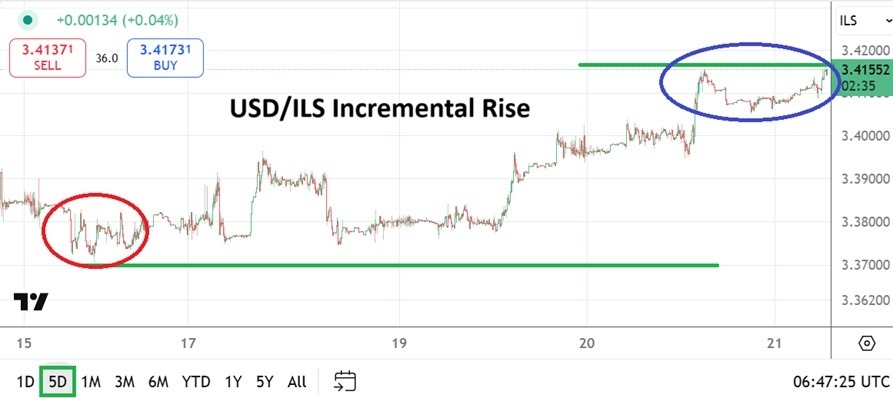
The USD/ILS is near 3.41600 as of this writing as relatively fast bids and asks are being displayed with a wide spread, which makes it rather dangerous for day traders to pursue the currency pair.

USD/ILS Analysis 21/08: Climb Up Develops (Chart)

The USD/ILS has incrementally climbed the past week, having waved goodbye to lows around 3.37550, while now traversing near the 3.41600 mark depending on the rate being offered via brokers’ platforms. The USD/ILS was around 3.32200 on the 23rd of July. Financial institutional may have a reason to be less confident in Israel’s economic strength, but this depends on perspectives.

The Israeli government continues to face high costs regarding militarily conflict. Although the nation is calm, fiscal reports show a rather high amount of spending regarding the ongoing troubles in Gaza. The Bank of Israel also kept it interest rate in place recently. But it could be argued the move higher in the USD/ILS correlates to the broad Forex market.

Yesterday’s sustained move above 3.40000 and renewed buying this morning are keeping the USD/ILS near values it traded early in August. However, it also needs to be pointed out that the currency pair touched the 3.45800 level at the end of the first week in August. While the USD/ILS has shown some price velocity in recent trading and a move higher the past handful of days, the Israeli Shekel does remain within the lower realms of its one year technical chart.

The movement higher in the USD/ILS may be a simple reaction to a lack of clarity which is sweeping through many financial institutions regarding U.S interest rates. It is widely believed the U.S Fed will reduce the Federal Funds Rate by 0.25 in the middle of September, but fears about the implications regarding tariffs effects continues to cause concerns about potential inflation developing. The broad Forex market has seen USD centric strength develop the past several days.

Resistance and Support Speculative Wagering

Day traders of the USD/ILS have been able to take advantage of solid price action in the currency pair the past week. There remains a low amount of volume in the USD/ILS, thus the use of risk taking tactics must be used wisely. Take profit orders are urged while wagering on the USD/ILS, this before profits disappear.

  • The belief that resistance levels will start to become durable may look attractive to traders with a bearish perspective, but the USD/ILS has traded higher not too long ago.
  • The Fed’s important Jackson Hole Symposium will be getting underway today.
  • Comments from global central bankers, including FOMC members, could cause some volatility which would spur on the USD/ILS regarding U.S interest rate clarity.
  • Cautious behavior among large players today and tomorrow may keep the USD/ILS within the higher elements of its near-term range now being traded.

USD/ILS Short Term Outlook:

Current Resistance: 3.41800

Current Support: 3.41300

High Target: 3.42800

Low Target: 3.40100

Ready to trade our Forex daily forecast? We’ve made a list of some of the best regulated brokers in Israel to choose from.

Source link

Visited 1 times, 1 visit(s) today

Related Article

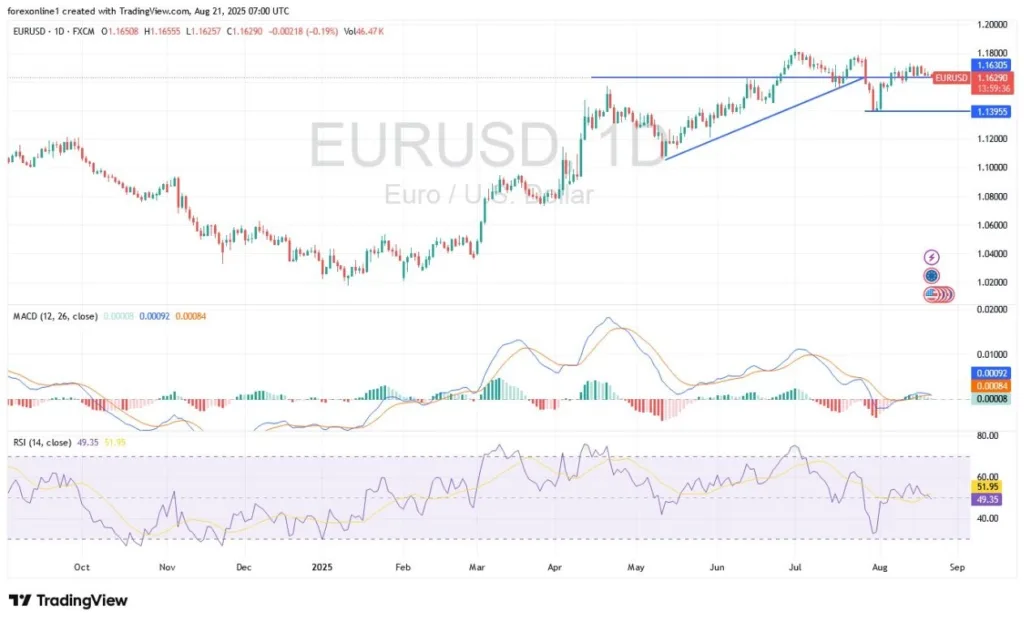
EUR/USD Analysis 21/08: Key Economic Readings (Chart)

EUR/USD Analysis 21/08: Key Economic Readings (Chart)

Created on August 21, 2025 EUR/USD Analysis Summary Today Overall Trend: Neutral with a downward bias. Today’s Support Levels: 1.1600 – 1.1550 – 1.1480. Today’s Resistance Levels: 1.1680 – 1.1730 – 1.1800. EUR/USD Trading Signals: Buy EUR/USD from the 1.1560 support level, with a target of 1.1800 and a stop-loss at 1.1500. Sell EUR/USD from

Goldman Traders Say It’s Time to Buy the Dip in Momentum Stocks

(Bloomberg) — Sharp losses in high-flying momentum stocks may present a dip-buying opportunity if history is any guide, according to Goldman Sachs Group Inc.’s trading desk. The traders cited rebounds after similar prior losses in Goldman’s High Beta Momentum basket, coupled with the current technical setup. Most Read from Bloomberg When the long-short momentum basket

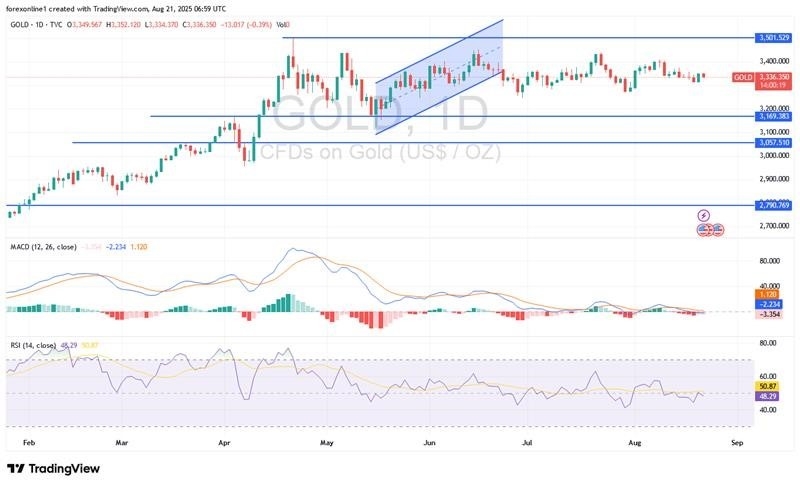
Gold Analysis 21/08: USD Recovery Increases Losses (Chart)

USD Recovery Increases Losses (Chart)

Created on August 21, 2025 Today’s Gold Analysis Overview: The overall Gold Trend: Neutral with a downward bias. Gold Support Levels Today: $3310 – $3270 – $3220 per ounce. Gold Resistance Levels Today: $3360 – $3350 – $3410 per ounce. Today’s Gold Trading Signals: Buy gold from the $3290 support level, with a target of

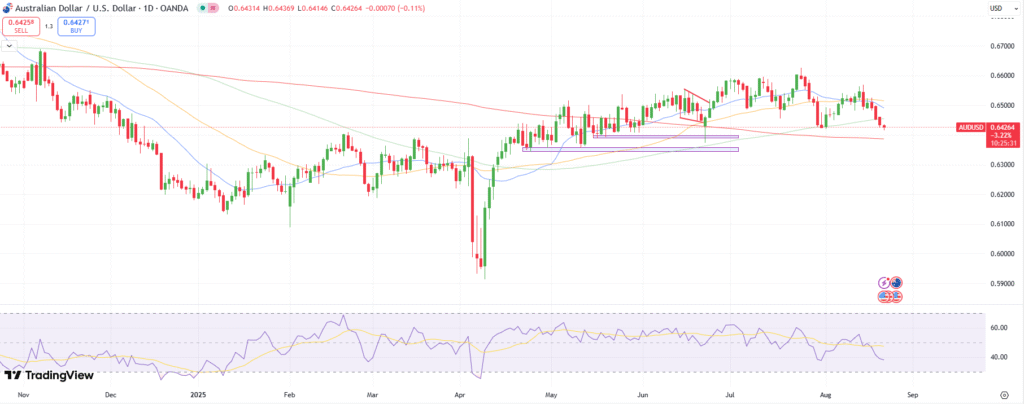
AUD/USD technical forecast

AUD/USD Forecast Extends Losses as Traders Await Jackson Hole

AUD/USD forecast remains subdued amid sour risk sentiment. Fed meeting minutes show no hint of aggressive easing. Australian PMI data shows a surge in economic activity The AUD/USD forecast remains bearish on Thursday as the pair slides to 0.6420 during the European session. The price stays around the weakest level in two months after posting

Short sellers reap over $5 billion on Big Tech bets as AI fears roil market

Short sellers betting against some of the market’s leading AI stocks potentially made billions as markets slid this week and investors moved away from some of the year’s hottest tech trades. On Wednesday, tech stocks stumbled for a second day, with the tech-heavy Nasdaq Composite’s (^IXIC) 0.7% drop leading declines in the major averages as

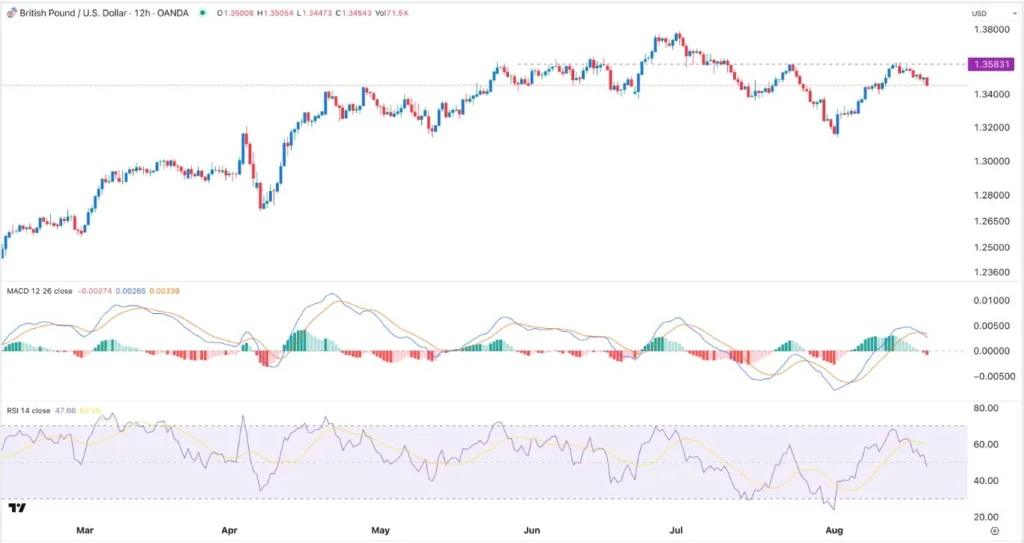
GBP/USD Forex Signal: Bearish Pressure Builds (Chart)

GBP/USD Forex Signal: Bearish Pressure Builds (Chart)

Created on August 21, 2025 Bearish view Sell the GBP/USD pair and set a take-profit at 1.3350. Add a stop-loss at 1.3585. Timeline: 1-2 days. Bullish view Buy the GBP/USD pair and set a take-profit at 1.3585. Set a take-profit at 1.3350. The GBP/USD exchange rate pulled back for three consecutive days, even as the

NZD/USD Analysis Today 21/08: Bears in Control (Chart)

NZD/USD Analysis Today 21/08: Bears in Control (Chart)

Created on August 21, 2025 Price velocity downwards was sparked in the NZD on late Tuesday, and lows have been demonstrated the past day as the 0.58190 vicinity continues to be tested. The NZD/USD has shown a tendency to display bearish behavior the past couple of months. The selling action has not been a stable