Hangs Out Near 200 Day EMA (Video)

Potential signal:

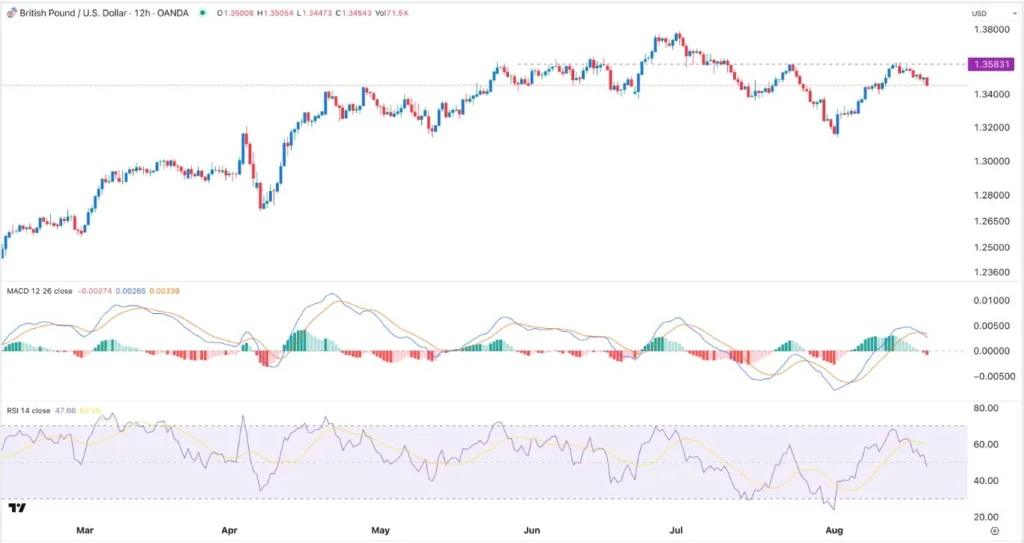
  • I am still bullish of this pair, and on a break of the 200 Day EMA, I am still buying with a stop at 1.38 and a target of 1.3990 area.

It’s been a pretty quiet trading session during Wednesday as the US dollar has gone both higher and lower against the Canadian dollar in a really tight range. It’s worth noting that we are sitting at the 200 day EMA indicator. And that of course offers a lot of technical noise. If we can break above the 200 day EMA, then it’s possible that we could go looking at the 1.40 level.

A pullback from here is very possible and that could open up a move down to the 1.38 level, possibly even the 50 day EMA, which sits just above the 1.3750 level. As long as we can stay above there, I think we’ve got a real shot at going higher given enough time.

USD/CAD Signal 21/08: Hangs Out Near 200 Day EMA (graph)

No Trade Agreement Between Countries

It does make a certain amount of sense considering that the United States and Canada still do not have any type of trade agreement that hurts Canada in a much more outsized way than it hurts the United States. And ultimately this is a scenario where I think if there’s a lot of fear around the world anyway, then the US dollar becomes more attractive in normal conditions, let alone what’s going on right now. Short term pullbacks continue to be buying opportunities. I have no interest in shorting this market. And of course, the interest rate differential continues to favor the US dollar. Really at this point in time, until we make a fresh new low below the 1.3550 level, I just don’t really want to short. I do think that we will rally eventually, and we may actually end up rallying for quite some time. At this point, I think it is probably just a matter of time before we take off.

Ready to trade our Forex USD/CAD predictions? Here are the best Canadian online brokers to start trading with.

Christopher Lewis has been trading Forex and has over 20 years experience in financial markets. Chris has been a regular contributor to Daily Forex since the early days of the site. He writes about Forex for several online publications, including FX Empire, Investing.com, and his own site, aptly named The Trader Guy. Chris favours technical analysis methods to identify his trades and likes to trade equity indices and commodities as well as Forex. He favours a longer-term trading style, and his trades often last for days or weeks.

Source link

Visited 1 times, 1 visit(s) today

Related Article

EUR/USD Analysis 21/08: Key Economic Readings (Chart)

EUR/USD Analysis 21/08: Key Economic Readings (Chart)

Created on August 21, 2025 EUR/USD Analysis Summary Today Overall Trend: Neutral with a downward bias. Today’s Support Levels: 1.1600 – 1.1550 – 1.1480. Today’s Resistance Levels: 1.1680 – 1.1730 – 1.1800. EUR/USD Trading Signals: Buy EUR/USD from the 1.1560 support level, with a target of 1.1800 and a stop-loss at 1.1500. Sell EUR/USD from

Goldman Traders Say It’s Time to Buy the Dip in Momentum Stocks

(Bloomberg) — Sharp losses in high-flying momentum stocks may present a dip-buying opportunity if history is any guide, according to Goldman Sachs Group Inc.’s trading desk. The traders cited rebounds after similar prior losses in Goldman’s High Beta Momentum basket, coupled with the current technical setup. Most Read from Bloomberg When the long-short momentum basket

Gold Analysis 21/08: USD Recovery Increases Losses (Chart)

USD Recovery Increases Losses (Chart)

Created on August 21, 2025 Today’s Gold Analysis Overview: The overall Gold Trend: Neutral with a downward bias. Gold Support Levels Today: $3310 – $3270 – $3220 per ounce. Gold Resistance Levels Today: $3360 – $3350 – $3410 per ounce. Today’s Gold Trading Signals: Buy gold from the $3290 support level, with a target of

AUD/USD technical forecast

AUD/USD Forecast Extends Losses as Traders Await Jackson Hole

AUD/USD forecast remains subdued amid sour risk sentiment. Fed meeting minutes show no hint of aggressive easing. Australian PMI data shows a surge in economic activity The AUD/USD forecast remains bearish on Thursday as the pair slides to 0.6420 during the European session. The price stays around the weakest level in two months after posting

Short sellers reap over $5 billion on Big Tech bets as AI fears roil market

Short sellers betting against some of the market’s leading AI stocks potentially made billions as markets slid this week and investors moved away from some of the year’s hottest tech trades. On Wednesday, tech stocks stumbled for a second day, with the tech-heavy Nasdaq Composite’s (^IXIC) 0.7% drop leading declines in the major averages as

GBP/USD Forex Signal: Bearish Pressure Builds (Chart)

GBP/USD Forex Signal: Bearish Pressure Builds (Chart)

Created on August 21, 2025 Bearish view Sell the GBP/USD pair and set a take-profit at 1.3350. Add a stop-loss at 1.3585. Timeline: 1-2 days. Bullish view Buy the GBP/USD pair and set a take-profit at 1.3585. Set a take-profit at 1.3350. The GBP/USD exchange rate pulled back for three consecutive days, even as the

NZD/USD Analysis Today 21/08: Bears in Control (Chart)

NZD/USD Analysis Today 21/08: Bears in Control (Chart)

Created on August 21, 2025 Price velocity downwards was sparked in the NZD on late Tuesday, and lows have been demonstrated the past day as the 0.58190 vicinity continues to be tested. The NZD/USD has shown a tendency to display bearish behavior the past couple of months. The selling action has not been a stable