Bullish view
- Buy the EUR/USD pair and set a take-profit at 1.1750.
- Add a stop-loss at 1.1550.
- Timeline: 1-2 days
Bearish view
- Sell the EUR/USD pair and set a take-profit at 1.1550.
- Add a stop-loss at 1.1750
")
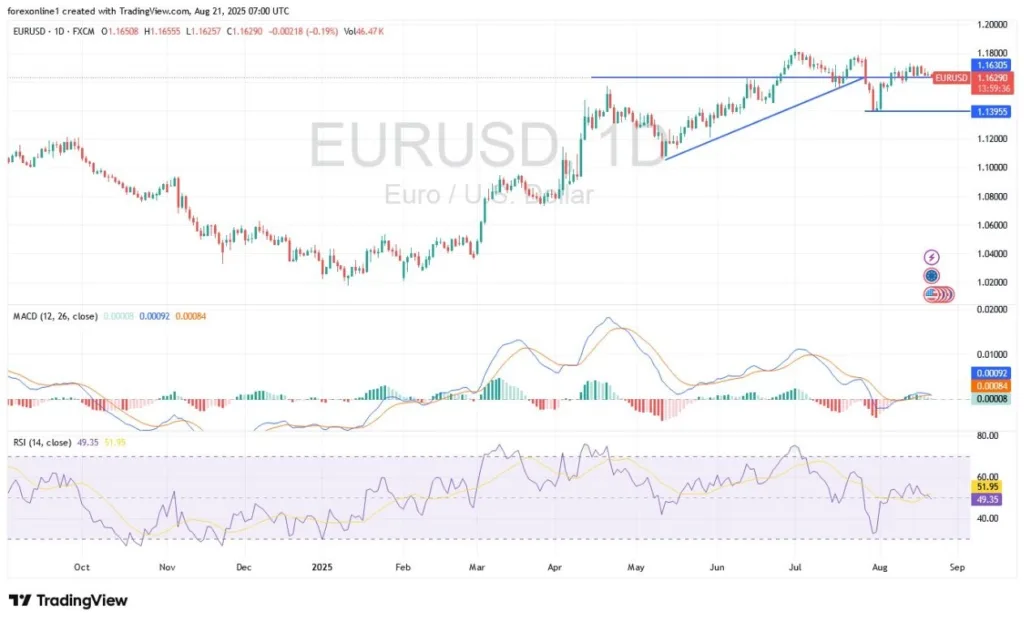
The EUR/USD pair was flat on Thursday, continuing a consolidation that has been going on in the past few days. It was trading at 1.1670, as market participants focused on the upcoming Jackson Hole Symposium.
FOMC Minutes and Jackson Hole Symposium
The EUR/USD exchange rate was stuck in a tight range after Christine Lagarde warned about the impact of tariffs on the European economy.
She maintained that the deal between the US and the EU was in line with the bank’s baseline and predicted that the economy would be affected.
Her statement came on the same day that Eurostat published the final reading of the July consumer inflation data. The data showed that the headline Consumer Price Index remained at 2% in July, while the core CPI remained at 2.3%.
These numbers mean that the bank has prevailed in its battle against inflation, partly helped by the strong euro, which has jumped by over 14% from the lowest level this year. Analysts expect just one cut this year
The EUR/USD exchange rate wavered after the Federal Reserve published minutes of the last monetary policy meeting in which officials left interest rates unchanged between 4.25% and 4.50%.
These minutes showed that officials remained concerned about inflation in the country as the impact of tariffs on the economy continued to spread. There is a likelihood that these officials will also focus on the labor market in the next meeting after the recent weak nonfarm payroll data
The next important catalysts for the EUR/USD exchange rate will be the flash manufacturing and services PMI numbers from the US and the European Union. These numbers will provide more information about the economy after the recent EU-US trade deal.
The EUR/USD pair will also react mildly to the upcoming US initial and continuing jobless claims numbers, existing home sales, and the Philadelphia Fed manufacturing index data. These numbers will come a day before Jerome Powell talks at the Jackson Hole Symposium.
EUR/USD Technical Analysis
The EUR/USD exchange rate remained in a tight range this week as focus remained on the upcoming Jerome Powell’s speech.
It remains below the important support, which connects the highest swings since July, forming the neckline of the inverse head-and-shoulders pattern, a popular bullish reversal sign.
The pair remains above the Ichimoku Kinko Hyo cloud and the 50-period Exponential Moving Average (EMA). Therefore, the pair will likely continue rising as bulls target the year-to-date high of 1.1835. A drop below the support at 1.1550 will cancel the bullish outlook.
Ready to trade our free Forex signals? Here are the top brokers in Europe to choose from.
Crispus Nyaga is a financial analyst, coach, and trader with more than 8 years in the industry. He has worked for leading companies like ATFX, easyMarkets, and OctaFx. Further, he has published widely in platforms like SeekingAlpha, Investing Cube, Capital.com, and Invezz. In his free time, he likes watching golf and spending time with his wife and child.