GBP/USD Forex Signal Today 18/08: More Gains (Chart)

Bullish View

  • Buy the GBP/USD pair and set a take-profit at 1.3785.
  • Add a stop-loss at 1.3450.
  • Timeline: 1-2 days.

Bearish View

  • Sell the GBP/USD pair and set a take-profit at 1.3450.
  • Add a stop-loss at 1.3785.

GBP/USD Forex Signal Today 18/08: More Gains (Chart)

The GBP/USD exchange rate continued its recent rally after the US economic data pointed to stagflation and the UK released a surprisingly strong GDP data. It was trading at 1.3552 on Monday, up sharply from this month’s low of 1.3136.

UK Inflation Data Ahead

The GBP/USD exchange rate continued rising after the UK published its jobs and GDP data. A report by the Office of National Statistics (ONS) showed that hiring slowed, even as wage growth continued. UK payrolls dropped for six consecutive months, while vacancies continued their downtrend.

At the same time, wage growth continued, leading to concens that inflation will be stickier for longer than expected. Another report showed that the UK economy grew at a faster pace than expected. It grew by 0.3% in Q2, better than the median estimate of 0.2%, and lower than the 0.7% growth in Q1.

The next key data to watch will be the upcoming UK consumer inflation data on Wednesday. Economists expect the data to show that the headline consumer inflation rose from 3.6% in June to 3.7% in July, while the core figure rose to 3.8%.

These numbers will confirm the view that the economy was in a stagflation period, which is characterized by high inflation and high unemployment rate. Stagflation will make it difficult for the Bank of England (BoE) to deliver its interest rate decision.

The GBP/USD exchange rate rose after US published strong consumer inflation data. The report showed that the headline consumer price index (CPI) remained at 2.7%, while the core CPI moved from 2.8% in June to 3.1%.

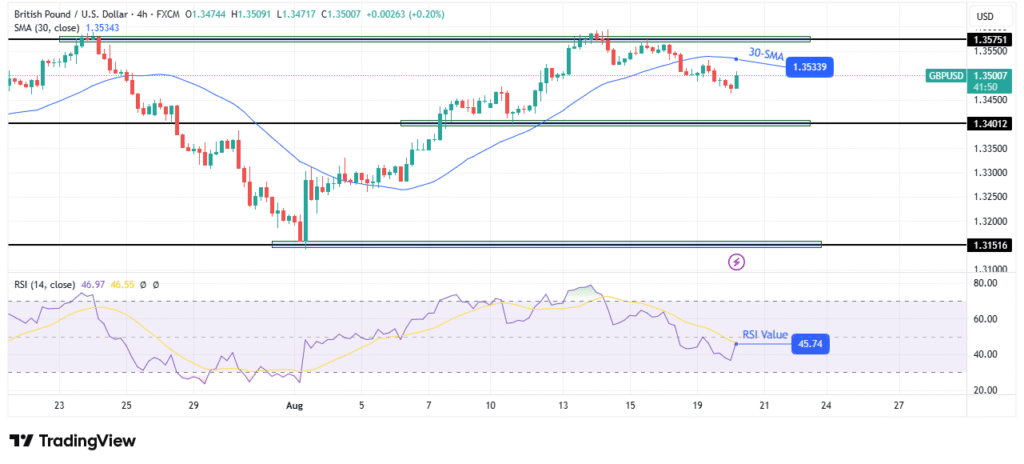
GBP/USD Technical Analysis

The 12-hour chart shows that the GBP/USD exchange rate bottomed at 1.3135, forming a double-bottom pattern. It has now crossed the 50-period and 100-period moving averages, which have now formed a bullish crossover.

The MACD indicator has moved above the zero line, while the Relative Strength Index (RSI) has rallied above 50. Therefore, the pair will likely continue rising as bulls target the key resistance at 1.3787, its highest point on July 1.

A move above that level will point to more gains, with the next key level to watch being at 1.3800. A move below the 50-period moving average at 1.3450 will invalidate the bullish forecast.

Ready to trade our free trading signals? We’ve made a list of the best UK forex brokers worth using.

Crispus Nyaga is a financial analyst, coach, and trader with more than 8 years in the industry. He has worked for leading companies like ATFX, easyMarkets, and OctaFx. Further, he has published widely in platforms like SeekingAlpha, Investing Cube, Capital.com, and Invezz. In his free time, he likes watching golf and spending time with his wife and child.

Source link

Visited 1 times, 1 visit(s) today

Related Article

Why Target’s new CEO won’t have a honeymoon period: Opening Bid top takeaway

Complacent investors have been hit with a reality check on tech stocks this week. Momentum favorite Palantir (PLTR) getting drilled again today. Nvidia (NVDA) is seeing mixed action. Queue the tech stock correction chatter! “Investors worry the tech rally is due for a pullback/correction with the constant valuation arguments front and center,” Wedbush analyst Dan

The US stock market declined for a second consecutive day on Wednesday(Bloomberg)

Why stock market is down today. Latest on Target, Amazon and other stocks

The stock market dipped on Wednesday, driven by a decline in tech stocks and Target announcing the appointment of a new CEO. The Nasdaq Composite dipped around 1.3%, and the S&P 500 slipped 0.9%. The Dow Jones Industrial Average lost 75 points, or 0.2%. The US stock market declined for a second consecutive day on

News Update – Pre-Markets

5 things to know before the stock market opens Wednesday

Here are five key things investors need to know to start the trading day: 1. Jackson Hole 101 It’s a good week to be a restaurant or hotel in Jackson Hole, Wyoming. Economic policymakers, market participants and government officials are descending on the town for the Kansas City Federal Reserve’s annual policy symposium, which kicks

Buy These 10 Uber-Cheap 'Revival Story' Stocks, BofA Says

Buy These 10 Uber-Cheap ‘Revival Story’ Stocks, BofA Says

2025-08-20T09:15:03Z Share Facebook Email X LinkedIn Reddit Bluesky WhatsApp Copy link lighning bolt icon An icon in the shape of a lightning bolt. Impact Link Save Saved Read in app This story is available exclusively to Business Insider subscribers. Become an Insider and start reading now. Have an account? Log in. Bank of America predicts

A person looks at three different computer screens displaying code and charts.

Prediction: Nvidia Stock Will Jump Higher After Aug. 27

The stock has gone on a parabolic run since hitting a 52-week low in April this year, and it seems primed for more upside following its upcoming earnings report. Nvidia (NVDA -3.47%) stock made a remarkable recovery on the stock market since hitting its 52-week low on April 7, rising an incredible 83% in such

The term

Meet the Monster Stock That’s Crushing Nvidia and Palantir on the Market

This AI infrastructure play has delivered bigger gains than its larger peers since going public earlier this year. Artificial intelligence (AI) supercharged the growth of Nvidia (NVDA -3.47%) and Palantir Technologies (PLTR -9.39%) in the past couple of years or so, and that’s not surprising, as both companies are playing a key role in the

USD/BRL Analysis 20/08: Near-Term Reversal Upwards (Chart)

USD/BRL Analysis 20/08: Near-Term Reversal Upwards (Chart)

Created on August 20, 2025 The USD/BRL will open its trading within eyesight of 5.5000 today, this after experiencing a buying trend the past handful of days after exploring lows around the 5.3800 realm on Friday. First of all the USD/BRL remains within the lower elements of its long-term technical range. Even the mid-term must

GBP/USD technical price analysis

GBP/USD Price Analysis: Stubborn Inflation to Halt BoE Cuts

The GBP/USD price analysis suggests a longer delay in Bank of England rate cuts. Inflation in the UK accelerated from 3.6% to 3.8%. Traders are awaiting the FOMC minutes. The GBP/USD price analysis suggests a longer delay in Bank of England rate cuts as UK inflation remains high. As a result, the pound recovered from