I wrote on 29th June that the best trades for the week would be:
- Long of the EUR/USD currency pair. This ended the week higher by 0.46%.
- Long of the NASDAQ 100 Index. This ended the week higher by 1.03%.
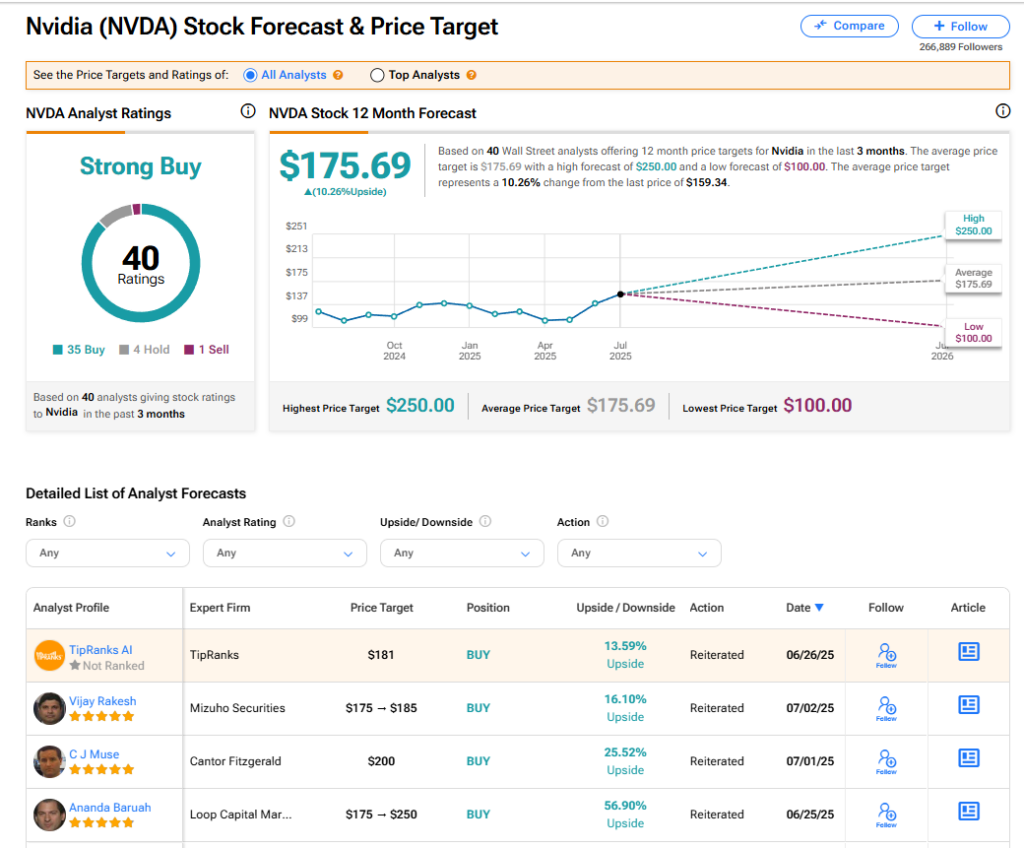
- Long of NVIDIA. This ended the week higher by 0.59%.
- Long of Silver in USD terms following a daily (New York) close above $37.25. This did not set up.
The overall win of 2.08% equals a gain of 0.52% per asset.
The news last week was dominated by positive risk-on sentiment continuing in US markets, which lifted both major US equity indices to new record highs, possibly boosted by the passage of President Trump’s flagship spending bill. The bill had looked in danger, but it was eventually pushed through both Houses of Congress. This is a win for President Trump, although the bill has been criticized as fiscally irresponsible by many on the right.
Sentiment was certainly boosted by the much stronger jobs and average hourly earnings data released in the USA on Thursday, which sent stock markets soaring as the data showed a much stronger than expected economy.
Although sentiment was risk-on last week, the sentiment is showing signs of slowing, and this is probably because Trump’s tariffs are now starting to come back into focus, with the coming Wednesday 9th July being Trump’s deadline for trade deals or higher tariffs, although President Trump has indicated he might extend the deadline again for at least some countries.
It does seem likely that President Trump will announce the exact rates of steeper tariffs which will start to apply Wednesday from early next week, and where there are no deal or bad deals, we could see some volatility in the stock markets and currencies of those countries, as we did earlier in 2025 when Trump’s higher tariffs first started being imposed..
Other market drivers last week related to certain high-impact data releases:
- US Average Hourly Earnings – this was expected to show a lower month-on-month increase of only 0.3% but it came in even lower, at 0.2%, suggesting a drop in wage inflationary pressures.
- US Non-Farm Employment Change – the number of new jobs created was much higher than expected, at 147k when 111k was widely expected.
- US JOLTS Job Openings – this was higher than expected, showing about 400k more jobs than expected.
- US Unemployment Rate – this fell unexpectedly from 4.2% to 4.1%.
- US ISM Services PMI – this was exactly as expected.
- US ISM Manufacturing PMI – slightly better than expected.
- Swiss CPI (inflation) – this unexpectedly showed a slightly higher rate of increase than expected, being a month-on-month rise of 0.2%.
- Chinese Manufacturing PMI – this was almost exactly as expected.
The coming week has a lighter program of high-impact data releases, with the most notable event likely to be the Reserve Bank of Australia’s policy meeting on Tuesday.
This week’s important data points, in order of likely importance, are:
- RBA Cash Rate & Rate Statement – RBA is expected to cut rates by 0.25%
- RBNZ Official Cash Rate & Rate Statement – RBNZ is expected to hold rates.
- UK GDP – expected to show a decline.
- US Unemployment Claims
- Canadian Unemployment Rate

For the month of July 2025, I forecasted that the EUR/USD currency pair will increase in value. The performance of this forecast so far is:

July 2025 Monthly Forecast Performance to Date
As there were no unusually large price movements in Forex currency crosses over the past week, I make no weekly forecast.
The Euro was the strongest major currency last week, while the British Pound was the weakest. Volatility decreased sharply last week, with only 7% of the most important Forex currency pairs and crosses changing in value by more than 1%. Next week’s volatility is likely to remain the same or possibly increase a little.
You can trade these forecasts in a real or demo Forex brokerage account.

Last week, the US Dollar Index printed a down candlestick which made the lowest weekly close since February 2022. There is clearly a strong and continuing long-term bearish trend in the US Dollar. However, the weekly candlestick has a long lower wick and almost looks like a bullish pin bar, which could make bears a bit nervous.
It makes sense to be trading in line with the long-term trend which will be short of the greenback, especially as risk appetite, particularly for American technology stocks, has returned in a big way as the major US indices break to new all-time high prices. Markets are still expecting the Fed to make three more rate cuts this year, despite the Fed’s slightly hawkish rhetoric, and this is helping to sink the Dollar.

The NASDAQ 100 Index rose again last week, closing very near the high of its range at a new all-time high price. These are very bullish signs, about as bullish as it is possible to get. However, it is worth noting that last week’s rise had less bullish momentum than the previous week. Also, NASDAQ 100 CFDs showed a decline on Friday although the US market was closed.
The NASDAQ 100 Index has an excellent track record of averaging an annual return well above 10% since it was founded in 1985. Furthermore, when it breaks out to a new all-time high, it usually does even better than that. These are powerful reasons to invest here, if you believe that the future will be like the past.
There are good sentimental reasons for bullishness in stock markets, especially in the USA, although we see economic contraction and higher than expected interest rates there. Yet the buoyant mood continues, lifted by the overwhelming US / Israeli victory in the Iran war, which seems to have taken the prospect of a nuclear Iran off the table for a few years at least, as well as opening the door perhaps to more peace deals with Israel, and possibly even the end of the war in Gaza.
I think there are excellent reasons to be long of this Index.
Dollar Tree is a component of the NASDAQ 100 Index, and it has attracted my interest due to its strongly bullish medium-term trend, although the price is not quite making a new 52-week high just yet. Dollar Tree is a leading thrift store, and with the economy holding up but with plenty of people starting to struggle after something of a slowdown, it is likely to continue seeing strong sales.
Dollar Tree’s price-to-earnings ratio is below average, suggesting that this equity is currently priced attractively. Coupling that with the strong bullish technical momentum and a wider Index and market breaking to new highs, and it looks like a buy.
There is one technical problem: Dollar Tree seems to be running into an area of resistance between $103.50 and $109, so I would not want to enter a new long trade here until we see a daily close above $109.

The S&P 500 Index rose again last week, closing very near the high of its range at a new all-time high price. These are very bullish signs, about as bullish as it is possible to get. However, it can be said that the bullish momentum has reduced.
The S&P 500 Index has an excellent track record of averaging an annual return of about 7%. Furthermore, when it breaks out to a new all-time high, it usually does even better than that. These are powerful reasons to invest here, if you believe that the future will be like the past.
Looking at the price chart below, we can see the tariff shock of a few weeks ago sent the price plummeting hard, but since then we have seen an extremely strong comeback reminiscent of the coronavirus crash and rebound of 2020. If this is a lesson to follow, we might expect continuing strong gains in US stock markets.
I think there are excellent reasons to be long of this Index.

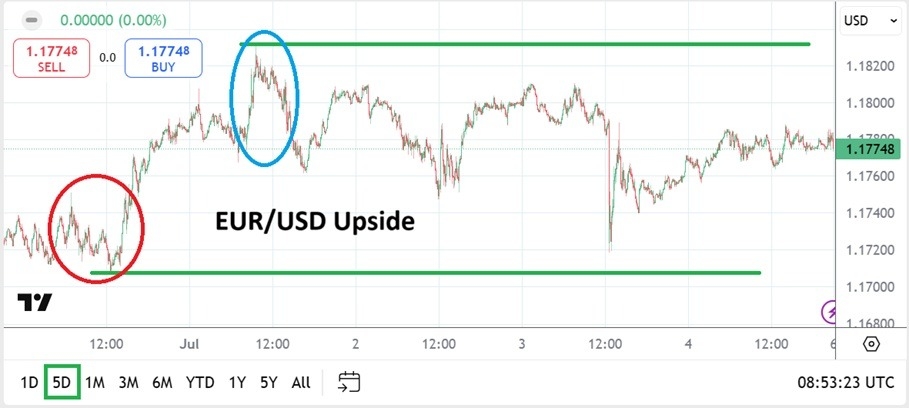
The EUR/USD currency pair is within a valid long-term bullish trend, and this currency pair has an excellent record of respecting such a trend.
The price rose last week but fell later after printing a new 3.5-year high. The weekly candlestick shown in the price chart below clearly has a significant upper wick, but this currency pair is prone to retracements even when it is rising with relatively strong momentum.
The Euro is the standout strong currency in the market right now and is also one of the primary beneficiaries of the continuing weakness in the US Dollar.
It is usually best to enter trend trades in this currency pair on a retracement (pull back), so I think it is OK to enter right away if you are not already long here.

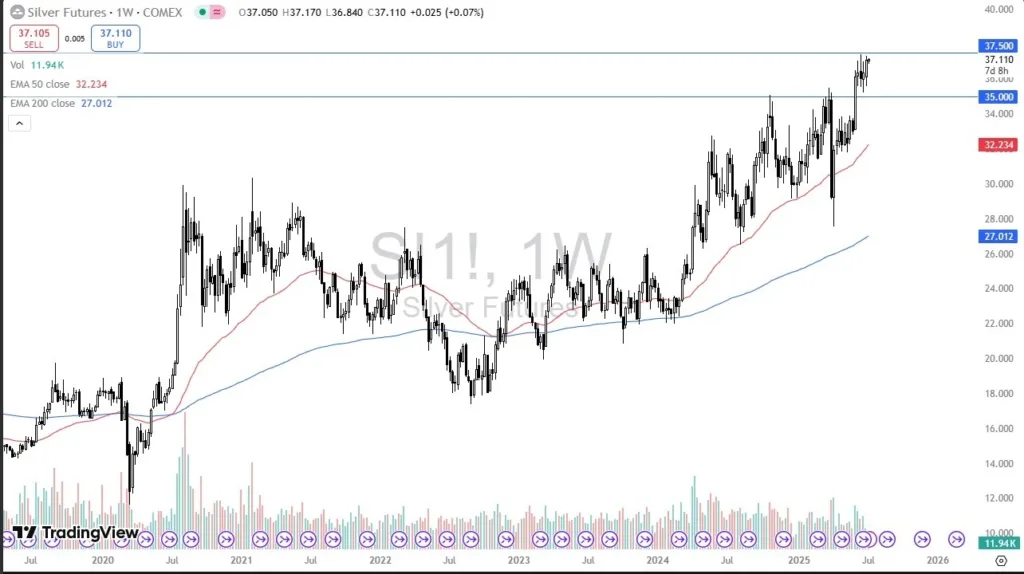
Silver in US Dollar terms had a strong week and continues to perform better than Gold or other precious metals such as Platinum and Palladium.
The price chart below shows that the price rose firmly last week and is not far from the multi-year high which it recently made.
All factors look bullish, with a weak USD as the counterpart, but the picture would look perfectly bullish if we can clear the recent high at $37.25, or at least the recent high closing price at $37.13.
I see Silver as a buy once we get a daily close above $37.13.

I see the best trades this week as:
- Long of the EUR/USD currency pair.
- Long of the NASDAQ 100 Index.
- Long of the S&P 500 Index.
- Long of DLTR following a daily (New York) close above $109.
- Long of Silver in USD terms following a daily (New York) close above $37.13.
Ready to trade our Forex weekly forecast? Check out our list of the top 5 Forex brokers in the world.