AUD/USD Weekly Forecast: Traders Gear Up for RBA Rate Cut

  • The AUD/USD weekly forecast indicates some bearish sentiment.
  • Risk sentiment was poor following the passage of Trump’s tax-cut bill through the US Senate.
  • The US economy added 147,000 jobs in June, above the forecast of 111,000.

The AUD/USD weekly forecast indicates some bearish sentiment as market participants prepare for an RBA rate cut.

Ups and downs of AUD/USD

The AUD/USD price had a bullish week but closed well below its highs. Initially, downbeat data at the start of the week helped support the Aussie. However, risk sentiment was poor after Trump’s tax-cut bill passed through the US Senate. At the same time, there was uncertainty ahead of Trump’s reciprocal tariff deadline.

Are you interested in learning more about Forex indicators? Check our detailed guide-

Moreover, the US released an upbeat employment report on Friday. The economy added 147,000 jobs in June, above the forecast of 111,000. At the same time, the unemployment rate was unexpectedly low at 4.1%. As a result, Fed rate cut expectations eased, and the dollar strengthened.

Next week’s key events for AUD/USD 

AUD/USD weekly technical forecastAUD/USD weekly technical forecast
AUD/USD Major Weekly Events

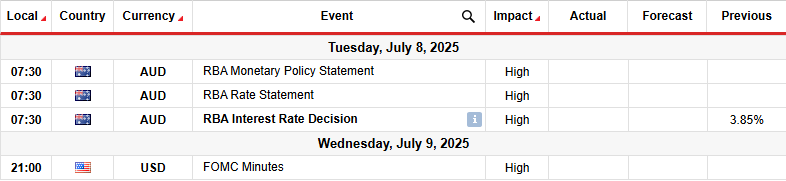
Next week, market participants will focus on the Reserve Bank of Australia policy meeting. Economists in a Reuters poll this week said they expect the central bank to cut interest rates a third time since inflation has eased and the economy is slowing down. The move might weigh on the Australian dollar. 

Meanwhile, traders will also pay attention to the FOMC policy meeting minutes. These might contain clues on the outlook for future rate cuts.

AUD/USD weekly technical forecast: Momentum fades after range breakout

AUD/USD weekly technical forecastAUD/USD weekly technical forecast
AUD/USD daily chart

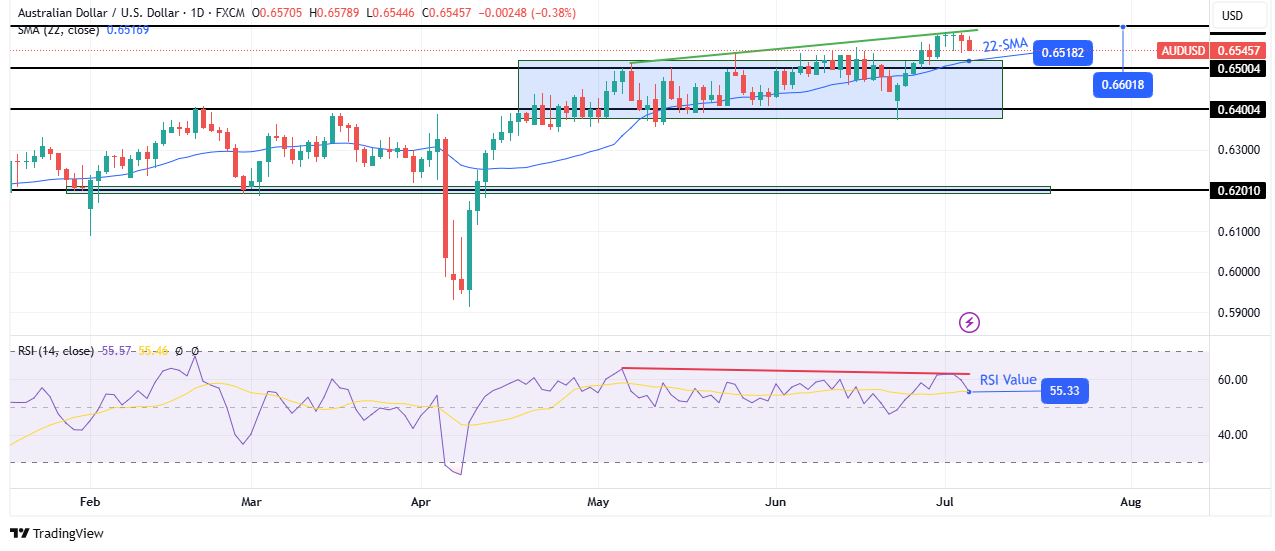
On the technical side, the AUD/USD price is pulling back after breaking out of a consolidation area. It still trades above the 30-SMA, a sign that bulls are in the lead. At the same time, the RSI trades slightly above 50, suggesting strong bullish momentum. 

Are you interested in learning more about Best Bitcoin Exchanges? Check our detailed guide-

After making a sharp bullish move, the price stalled and began trading between the 0.6400 support level and the 0.6500 resistance level. The range held for some time until bulls gained enough momentum to push the price out of the consolidation. 

However, while the price has made a higher high, the RSI has not. This indicates that momentum is waning from its previous high. Therefore, bulls might struggle to reach and break above the 0.6601 level. Meanwhile, if bears become stronger, the price will likely break below the SMA and return to the range area.

Looking to trade forex now? Invest at eToro!

68% of retail investor accounts lose money when trading CFDs with this provider. You should consider whether you can afford to take the high risk of losing your money.


Source link

Visited 1 times, 1 visit(s) today

Related Article

Two investors at home look at something on a laptop.

Billionaire Michael Platt Just Made a Move that Would Please Warren Buffett

Billionaire investors have proven their talents over the years by producing big returns for clients and for themselves. They don’t all make the same moves at the same times, though — and sometimes they pivot in completely opposite directions. For example, in the past year, Stanley Druckenmiller of the Duquesne Family Office sold all of

EUR/USD Weekly Forecast 06/07: Higher Price Range (Chart)

EUR/USD Weekly Forecast 06/07: Higher Price Range (Chart)

The EUR/USD has been able to hold onto the upper elements of its long-term price range. Yes, the currency pair went into the weekend well below its high around 1.18315 touched last Tuesday, but the broad Forex market saw volumes start to decrease significantly on Thursday and into Friday before going into the weekend. The

Weekly Forex Forecast - July 06th

Weekly Forex Forecast – July 06th

I wrote on 29th June that the best trades for the week would be: Long of the EUR/USD currency pair. This ended the week higher by 0.46%. Long of the NASDAQ 100 Index. This ended the week higher by 1.03%. Long of NVIDIA. This ended the week higher by 0.59%. Long of Silver in USD

ET logo

Jane Street case: Shankar Sharma raises concerns over exchanges’ oversight

Veteran investor Shankar Sharma has raised sharp questions about the role of Indian stock exchanges in the recent Jane Street controversy, suggesting that profit motives may have prevented timely action against the global trading firm. In a post on X (formerly Twitter), Sharma questioned why the exchanges did not act sooner against Jane Street, even

Silver 06/07/2025

Weekly Pairs in Focus – July 06

Silver has been very bullish during the past week, but as you can see from the weekly chart, the market continues to bounce around $35 on the bottom and the $37.50 level above. All things being equal, this is a market that continues to be very noisy, and I think this is a situation where

Retail investors reap big gains from ‘buying the dip’ in US stocks

Retail investors reap big gains from ‘buying the dip’ in US stocks

Stay informed with free updates Simply sign up to the US equities myFT Digest — delivered directly to your inbox. Retail traders “buying the dip” in US stocks this year have racked up the biggest profits since the early stages of the Covid-19 crisis, helping to fuel a rally that has pushed Wall Street equities

ET logo

Jane Street aftermath: 4 stocks suffer Rs 12,000 crore wipeout in collateral damage

Markets regulator Sebi’s investigation into Jane Street may have unintended consequences for Dalal Street, as was evident on Friday when four capital market-related stocks collectively lost Rs 12,000 crore in market value. The regulatory action has exposed the market’s dependence on proprietary trading firms and their domestic partners. What began as targeted enforcement against alleged

0
Would love your thoughts, please comment.x
()
x