Quick overview
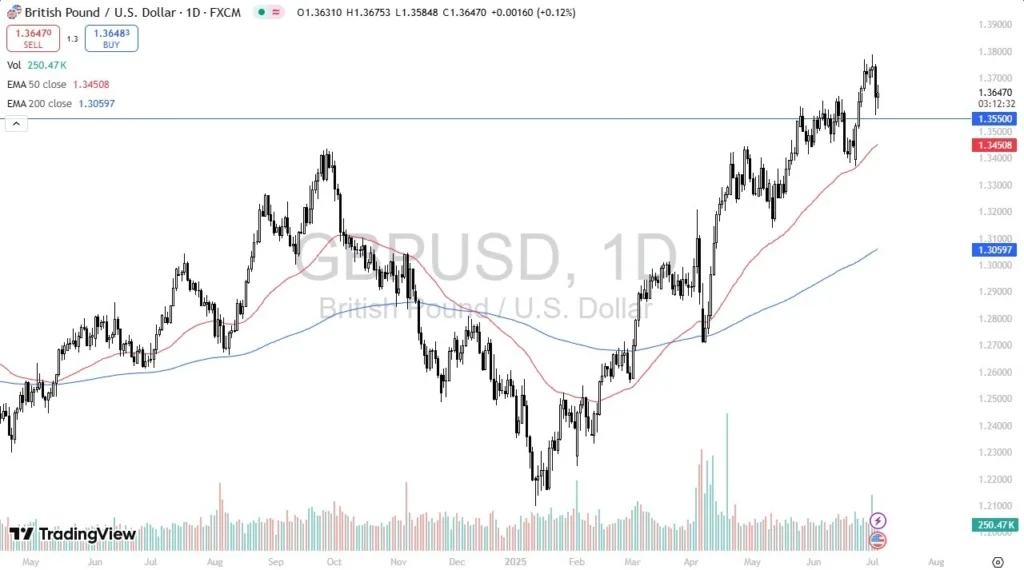
- The US dollar weakened despite strong job openings data, with the euro and pound reaching new highs against it.
- US stock indices showed mixed performance, with the Dow and Russell 2000 rising while the S&P 500 and Nasdaq fell due to a shift away from tech stocks.
- Political uncertainty surrounding a tax reform plan added to market caution, as last-minute resistance from conservative members emerged.
- Bitcoin tested support levels before bouncing back, while Ethereum outperformed with a significant rally driven by institutional interest.
Live BTC/USD Chart
BTC/USD

Yesterday markets produced another day of mixed action, with the dollar weakening, tech stocks falling, and strong job openings data adding to uncertainty around rate cuts.
Dollar Loses Ground Again Despite Strong Job Openings
Once again, the US dollar found itself under pressure, as both the euro and the pound rallied to fresh 2025 highs against the greenback. The move came despite a surprisingly strong JOLTS report, which showed 7.769 million job openings in June, well above the 7.3 million consensus estimate. The ISM Manufacturing PMI also came in slightly better than expected at 49.0, compared to last month’s 48.5 and forecasts of 48.8, signaling that while factory activity remains in contraction, it continues to stabilize.
Meanwhile, Fed Chair Jerome Powell spoke at the ECB Forum in Sintra, Portugal, where he struck a careful tone. While he did not rule out a potential rate cut in July, he also avoided signaling any urgency, aware of the political pressure from President Trump, who has repeatedly criticized the Fed’s reluctance to ease monetary policy more aggressively.
Equities See Mixed Performance as Tech Stocks Slide
US stock indices delivered a highly divergent performance. The Dow Jones Industrial Average surged 0.91%, and the small-cap Russell 2000 rose 0.94%, reflecting investor rotation into cyclical and value stocks. However, the S&P 500 slipped 0.11%, and the tech-heavy Nasdaq fell 0.82% as traders pulled capital out of large-cap tech companies, including Nvidia, Palantir, and AMD.
The rotation into more traditional sectors suggested growing caution over the stretched valuations of high-growth names, especially after a remarkable run in the first half of 2025.
Tax Plan Uncertainty Adds to Caution
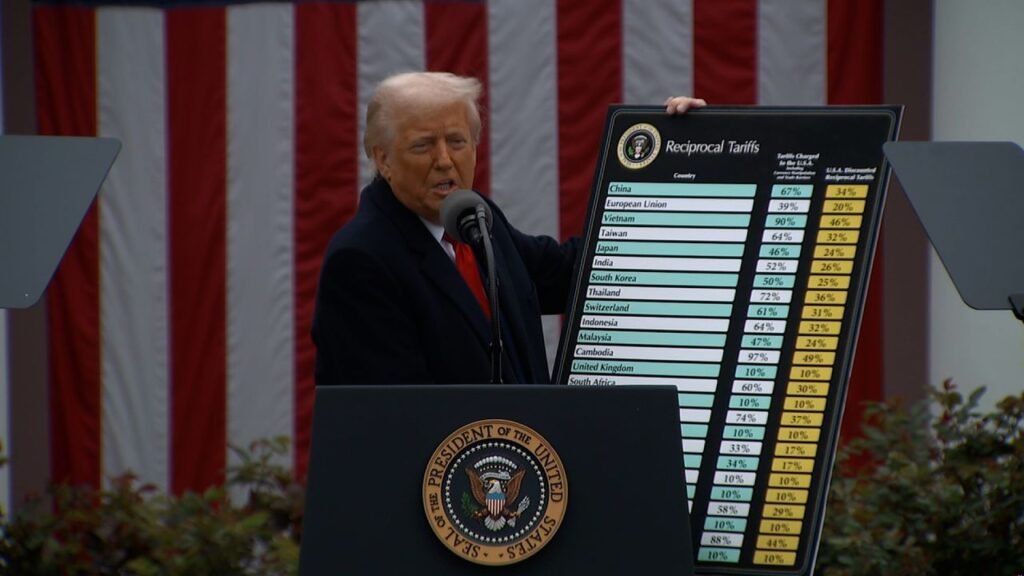
Adding to the market’s unease was fresh political uncertainty. Although the ambitious tax reform plan cleared the Senate, reports circulated that amendments to expenditure provisions had angered conservative Freedom Party members in the House. With President Trump expected to sign the bill on July 4, doubts about last-minute resistance have kept markets on edge.
Today’s Key Data and Events
Looking ahead, today’s primary focus will be the ADP Non-Farm Employment Change, forecast to rebound to 99,000 jobs in June from just 37,000 previously. The Eurozone unemployment rate is expected to hold steady at 6.2%. Later in the session, ECB President Christine Lagarde will speak. While the ECB has signaled no immediate rate cuts, investors will watch closely for any hints of a softer stance.
Last week, markets were slower than what we’ve seen in recent months, with gold retreating as a result, the EUR/USD jumping above 1.18 but returned back below it, while S&P and Nasdaq retreated yesterday, but Dow Jones kept pushing higher. The moves weren’t too big though, and we opened 35 trading signals in total, finishing the week with 23 winning signals and 12 losing ones.
The 20 Daily SMA Turns Into Resistance for Gold?
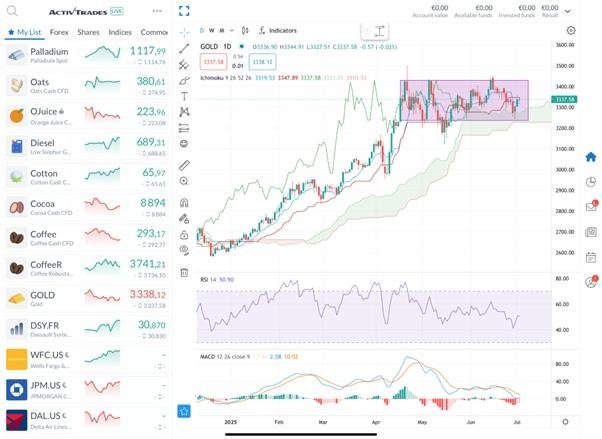
On the commodities front, gold has been sending a clear warning. After surging to an all-time high near $3,500 per ounce in April, XAU/USD has sharply reversed, closing last week below its 50-day simple moving average—a level that had held for nearly a year. The breakdown points to a loss of bullish momentum and raises the risk of deeper declines, with traders now eyeing the 100-day SMA near $3,150 as the next support area.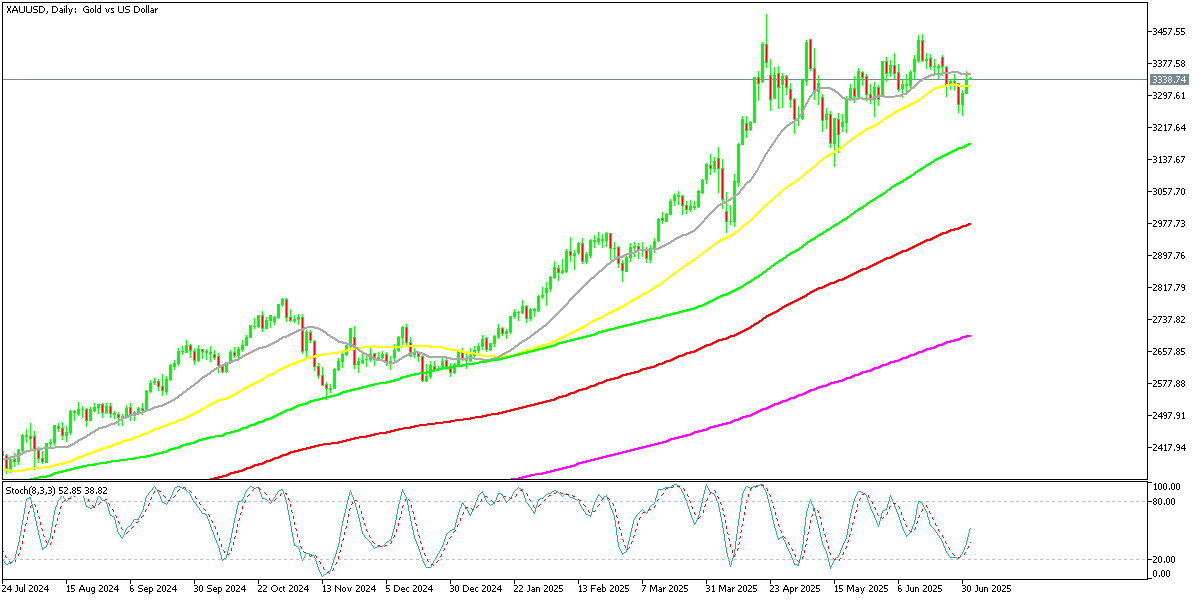
USD/JPY: Resistance Holds Despite Yield Chasing
Currency markets have been no less volatile. Earlier in the week, USD/JPY climbed from 143.40 to 148, defying conventional expectations around rate differentials. Analysts attributed the rally to global yield-chasing and capital outflows from Japan rather than monetary policy alone. The pair once again ran into strong resistance at the 100-week SMA, suggesting further gains will likely require a broader shift in risk appetite. Support remains around 142.70, with resistance near 145.00.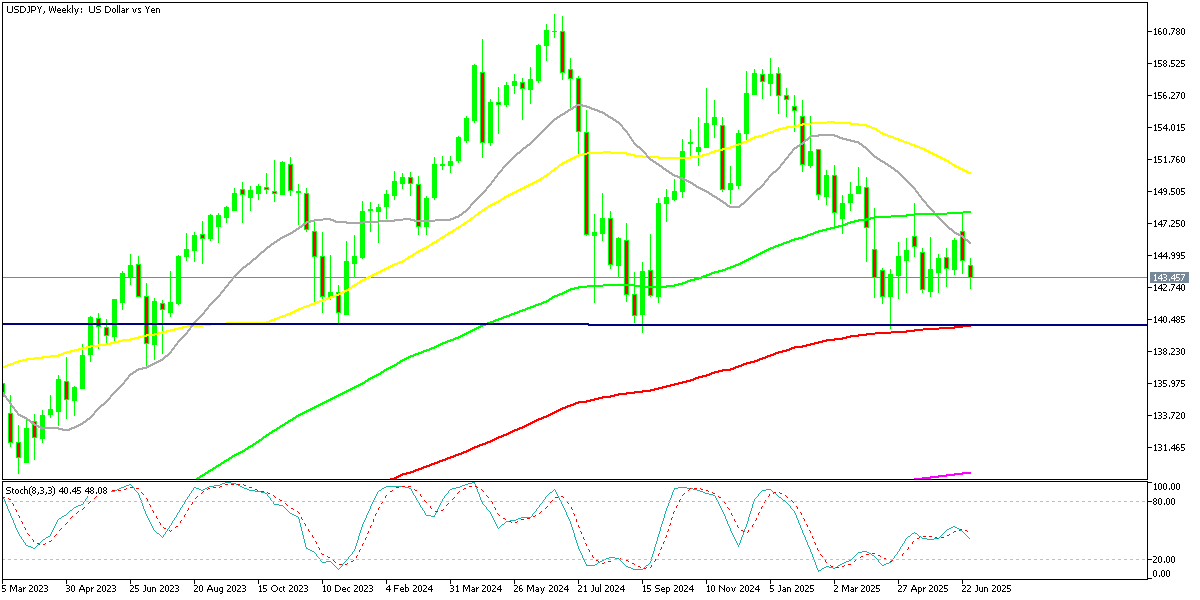
USD/JPY – Weekly Chart
Cryptocurrency Update
Bitcoin Tests Support Levels Before Bouncing
Bitcoin also faced selling pressure earlier in the week, breaking below its 50-day moving average near $104,000 and then slipping under $100,000 for the first time since early May. However, this dip was quickly seen as a buying opportunity by long-term investors. Buyers stepped in around the 20-week simple moving average (gray), lifting prices by roughly $10,000 to finish the week closer to $108,000, signaling ongoing confidence among committed holders.
BTC/USD – Weekly chart
Ethereum Outpaces Bitcoin Amid Technical Tailwinds
Ethereum (ETH) has outshone Bitcoin in recent weeks, rallying over 20% since April on institutional buying and excitement over the Pectra upgrade. The technical focus is now the 200-day moving average. A breakout above this level could open the path toward $4,000—potentially allowing ETH to outperform BTC through the summer.
ETH/USD – Daily Chart
Skerdian Meta
Lead Analyst
Skerdian Meta Lead Analyst.
Skerdian is a professional Forex trader and a market analyst. He has been actively engaged in market analysis for the past 11 years. Before becoming our head analyst, Skerdian served as a trader and market analyst in Saxo Bank’s local branch, Aksioner. Skerdian specialized in experimenting with developing models and hands-on trading. Skerdian has a masters degree in finance and investment.