USD/JPY Price Analysis: Rising Fiscal and Trade Fears Boost Yen

  • The USD/JPY price analysis indicates rising demand for the safe-haven yen.
  • Uncertainty over trade deals dampened risk appetite.
  • Goldman Sachs believes the Fed will deliver three 25-bps rate cuts this year.

The USD/JPY price analysis indicates rising demand for the safe-haven yen amid fiscal and trade uncertainty. At the same time, the dollar weakened due to increasing expectations for Fed rate cuts this year. 

Are you interested in learning more about MT5 brokers? Check our detailed guide-

The yen surged on Tuesday as fiscal concerns in the US prompted traders to seek safety. Market participants are concerned about Trump’s huge tax-cut and spending Bill. If it passes, it will add to the country’s debt burden. 

At the same time, uncertainty over trade deals dampened risk appetite. As a deadline for reciprocal tariffs approaches, most countries have yet to sign deals with the US. On Monday, Trump complained that Japan had refused to import rice from the US, despite having a shortage. Moreover, he warned of letters announcing high tariffs to partners who would not agree to the US’s trading conditions. 

Elsewhere, the dollar was fragile as markets increasingly bet on Fed rate cuts. The impact of tariffs on the US economy so far has been muted. However, the labor market has slowed down significantly. As a result, Goldman Sachs believes the Fed will deliver three 25-bps rate cuts this year. 

Meanwhile, economists expect further softness in the upcoming nonfarm payrolls report. This could put more pressure on the Fed to cut interest rates.

USD/JPY key events today

  • BOJ Governor Ueda Speaks
  • Fed Chair Powell Speaks
  • ISM Manufacturing PMI
  • JOLTS Job Openings

USD/JPY technical price analysis: Bears eye 142.55 after trendline breakout

USD/JPY technical price analysisUSD/JPY technical price analysis
USD/JPY 4-hour chart

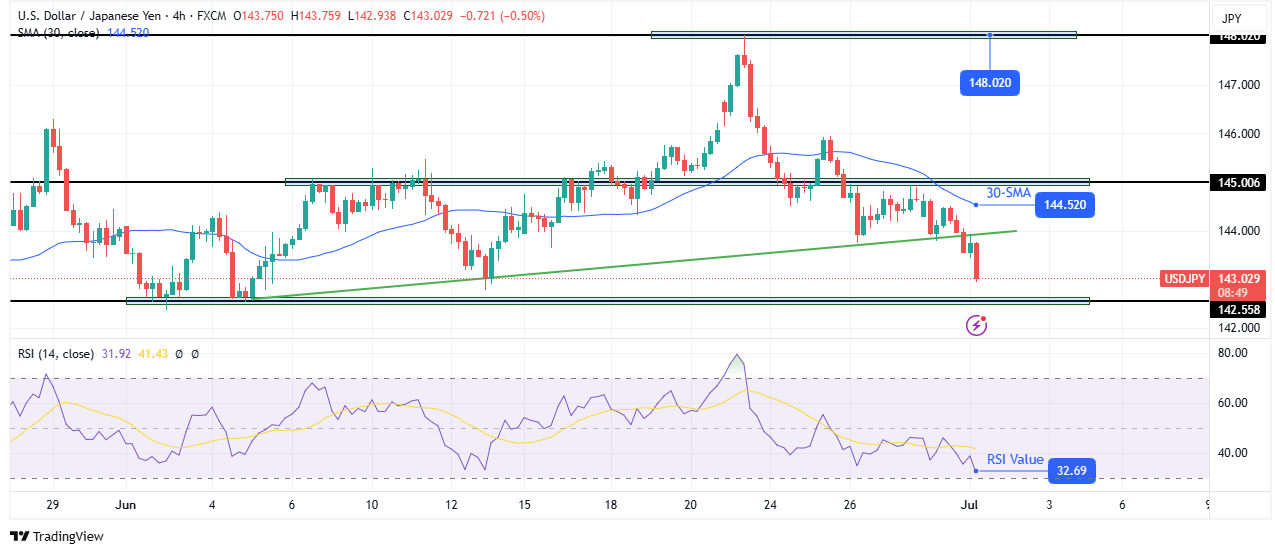
On the technical side, the USD/JPY price has made a milestone move, breaking below its shallow bullish trendline. At the same time, the price trades well below the 30-SMA. Meanwhile, the RSI is approaching the oversold region, indicating a strong bearish bias. 

Are you interested in learning more about forex signals telegram groups? Check our detailed guide-

The downtrend started after a sharp reversal at the 148.02 key level. Bears pushed the price below the 30-SMA. Moreover, the price started making lower highs and lows, respecting the SMA as resistance. The recent trendline breakout has solidified the bearish bias, with the next target at the 142.55 support level. 

After such a steep decline, USD/JPY might pause at 142.55. However, the bearish bias will remain as long as the price stays below the SMA. A break below 142.55 would increase the downside potential.

Looking to trade forex now? Invest at eToro!

68% of retail investor accounts lose money when trading CFDs with this provider. You should consider whether you can afford to take the high risk of losing your money.

Source link

Visited 1 times, 1 visit(s) today

Related Article

Two people looking at paper, smiling, and raising fists in air in celebration.

Why Shares of Bitmine Immersion Technologies Are Skyrocketing Today

Shares of the Bitcoin mining company Bitmine Immersion Technologies (BMNR 35.69%) had blasted nearly 50% higher as of 10:41 a.m. ET today. The stock continued its impressive run this week after the company announced yesterday that it would pursue an Ethereum treasury strategy. Following Strategy’s playbook Bitmine announced yesterday that it had raised $250 million

Intraday chart for Microsoft Corporation

US Equity Indexes Mixed, Treasury Yields Rise in Midday Trading

Real-time USA 04:36:01 2025-07-01 pm EDT After hours 04:00:30 pm 6,198.01 PTS -0.11% 6,200.17 +0.03% Published on 07/01/2025 at 12:27 This article is reserved for members Unlock the article: REGISTER NOW! © MT Newswires – 2025 Equity Markets Close Mixed as Powell Cites Tariffs for Unchanged Rates 04:32pm MT US Equity Markets Mixed After Fed

Gold Analysis Today 01/07: Prices Attempt to Recover (Chart)

Prices Attempt to Recover (Chart)

Today’s Gold Analysis Overview: The overall Gold Trend: Attempting to maintain a bullish outlook. Today’s Gold Support Levels: $3262 – $3200 – $3140 per ounce. Today’s Gold Resistance Levels: $3318 – $3360 – $3400 per ounce. Today’s gold trading signals update: Sell Gold from the resistance level of $3373 with a target of $3240 and

無綫新聞 TVB News

Qinghai farmers hope to use Hong Kong as gateway to global market

發佈日期: 2025-07-01 21:15 TVB News 粵 已複製連結 Qinghai’s climate and nature have made it easier for livestock and fish to be raised in a more organic way. In the sixth part of our Qinghai series, Jacky Lin travels to two Tibetan autonomous prefectures where locals hope to use Hong Kong as a gateway to the

EUR/USD Analysis Today 01/7: Strong Until Key Events (Chart)

Strong Until Key Events (Chart)

EUR/USD Analysis Summary Today Overall Trend: Bullish. Today’s EUR/USD Support Levels: 1.1720 – 1.1650 – 1.1580. Today’s EUR/USD Resistance Levels: 1.1800 – 1.1880 – 1.2000. EUR/USD Trading Signals: Buy EUR/USD from the support level of 1.1590 with a target of 1.1820 and a stop-loss at 1.1460. Sell EUR/USD from the resistance level of 1.1820 with

USD/INR Monthly Forecast: July 2025 (Chart)

USD/INR Monthly Forecast: July 2025 (Chart)

The USD/INR reacted with buying in the midst of the Middle East conflict which escalated two weeks ago, but since reaching highs near the 86.9600 vicinity the currency pair has returned to a known lower price realm. The USD/INR appears ready to enter the month of July near values it began the month of June.

ETF Edge: Growing Middle East tensions, mitigating risk and contrarian ETF plays

In market rally to new record, best tech trade hasn’t been ‘Mag 7’

In recent years, the technology sector, especially its biggest names like Apple, had developed the reputation of being the safest choice in a volatile stock market. Tech stocks are now back, even after the big hit many took in 2025’s first half. At the first half’s closing low on April 8, the S&P 500 was

0
Would love your thoughts, please comment.x
()
x