President Donald Trump’s 90-day pause on higher reciprocal tariff rates ends on July 9.
Over multiple decades, no asset class has delivered a higher average annual return to investors than stocks. But despite this outperformance, it doesn’t mean that Wall Street’s major stock indexes get from point A to point B in a straight line.
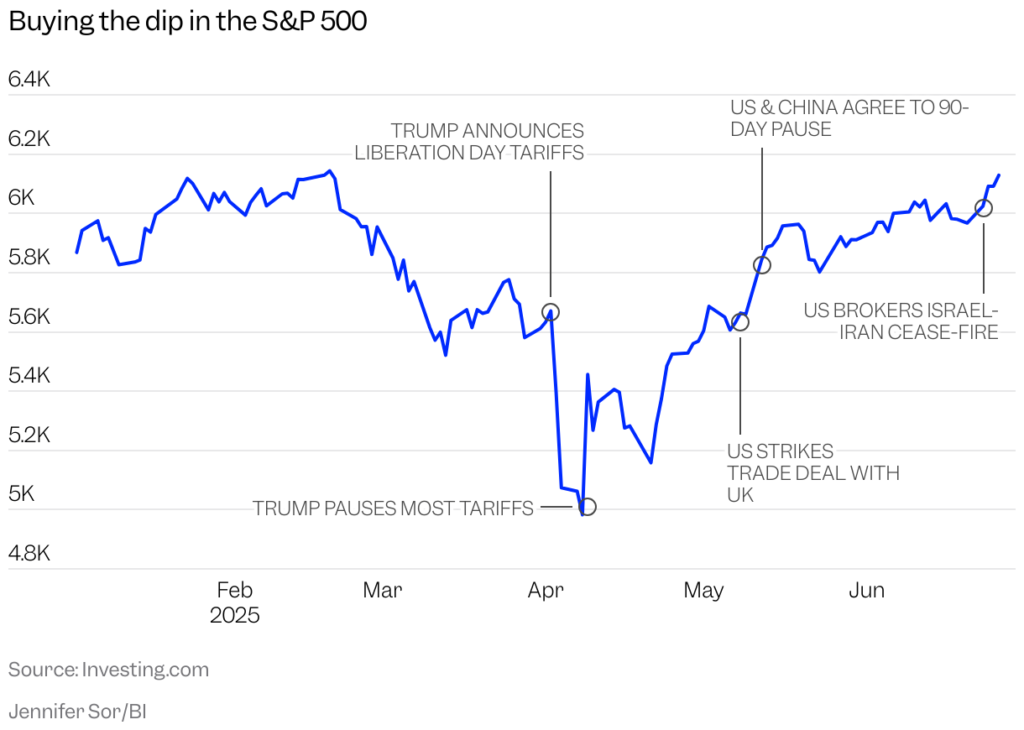
The first half of 2025 has been particularly volatile for equities. After the iconic Dow Jones Industrial Average (^DJI 1.00%), benchmark S&P 500 (^GSPC 0.52%), and growth-powered Nasdaq Composite (^IXIC 0.52%) hit respective all-time highs between December 2024 and mid-February 2025, the Dow and S&P 500 dipped into correction territory, with the Nasdaq entering a full-blown bear market.
During a one-week period in early April, the S&P 500 endured its fifth-largest two-day percentage drop in 75 years (-10.5%) and enjoyed its biggest single-session point gain in history.

President Trump discussing tariffs in the Oval Office. Image source: Official White House Photo.
These wild stock market gyrations are the result of President Donald Trump’s “Liberation Day” tariff announcements on April 2. Following the close of trading on April 2, Trump unveiled a 10% sweeping global tariff and implemented higher “reciprocal tariff” rates on dozens of countries that have historically carried adverse trade imbalances with America. This announcement is what precipitated the S&P 500’s aforementioned 10.5% cumulative drop over two sessions.
But in a surprise move, the president capitulated on April 9 by implementing a 90-day pause of these higher reciprocal tariff rates for all countries except China (a separate 90-day reciprocal tariff relief was reached with the world’s No. 2 economy in May). This 90-day pause is what led to the respective largest single-day point gains in the history of the Dow, S&P 500, and Nasdaq Composite on April 9.
There’s just one problem…this 90-day reciprocal tariff pause window ends in 11 days. Is another “Trump dump” of stocks imminent?
Historical precedent is a worry for Wall Street
The 90-day window, which began at 12:01 a.m. EDT on April 10, will officially end at midnight when the calendar changes over to July 9. This will reintroduce substantially higher tariff rates for dozens of countries.
Trump’s tariff and trade policy comes with a number of unknowns. For instance, there’s the possibility that tariffs could worsen trade relations with America’s top trade partners, as well as incite anti-American sentiment in overseas markets toward U.S. goods.
Another worry, highlighted by four New York Federal Reserve economists from Liberty Street Economics in “Do Import Tariffs Protect U.S. Firms?”, is the lack of differentiation between input and output tariffs. Output tariffs are duties placed on finished goods brought into the country, while input tariffs apply to goods used to manufacture/complete finished products in America. Input tariffs can increase the domestic rate of inflation and weigh on corporate margins.

Image source: Getty Images.
But historical precedent is the true concern.
When Donald Trump introduced tariffs on China in 2018-2019, the stocks directly impacted by the tariffs performed considerably worse than those unaffected by them on announcement days. We witnessed the adverse impact that announcement days can have on stocks on April 3 and April 4 of this year.
Worse yet, the deleterious effects of tariffs on businesses lasted well beyond their initial announcement. Liberty Street Economics found that from 2019 to 2021, profits, employment, sales, and labor productivity, on average, fell for businesses directly impacted by Trump’s China tariffs.
While this doesn’t intimate that a “Trump dump” is imminent, it does strongly lean toward negative future returns for stocks if this 90-day reciprocal tariff pause expires without any real resolution.
The biggest threat to stocks, arguably, has little to do with Donald Trump
There’s no question that this rapidly approaching 90-day reciprocal tariff pause is important to the health of the U.S. economy and investors — but it may not be Wall Street’s biggest threat.
Though President Trump inherited a bull market, he entered office for his nonconsecutive second term with stocks at one of their priciest valuations in history.
Most investors rely on the traditional price-to-earnings (P/E) ratio as their measure of value when comparing stocks. This ratio, which divides a company’s share price by its trailing-12-month earnings per share (EPS), tends to work great for mature businesses but can get tripped up by growth stocks and periods of recession where EPS plummets or turns negative.
The S&P 500’s Shiller P/E ratio, which is also referred to as the cyclically adjusted P/E ratio (CAPE ratio), does a better job of making apples-to-apples valuation comparisons on a back-tested basis. The Shiller P/E is based on average inflation-adjusted EPS over the prior 10 years.

S&P 500 Shiller CAPE Ratio data by YCharts. CAPE Ratio = cyclically adjusted price-to-earnings ratio.
Shortly before Donald Trump was inaugurated, the S&P 500’s Shiller P/E nearly touched a multiple of 39, which is its third-highest reading when back-tested to January 1871. It also represented a 125% premium to the average Shiller P/E multiple over a 154-year period.
What’s particularly worrisome about the Shiller P/E is how stocks have previously responded when surpassing and maintaining a reading of 30 for at least two months. Including the present, this scenario has occurred six times in 154 years.
Following the five prior instances where the Shiller P/E topped 30, the Dow Jones Industrial Average, S&P 500, and/or Nasdaq Composite, eventually (keyword), shed 20% to 89% of their value. This is to say that premium stock valuations weren’t tolerated over extended periods. Even if there were a reciprocal tariff resolution from the White House, stocks would still be historically pricey.
Thankfully, history is a pendulum that swings in both directions
When it comes to tariffs and pricey stock markets, history hasn’t worked in favor of investors. But when examined with a wide lens (i.e., over multiple decades), there’s no greater ally for investors than time and history.
At any given point, there are always headwinds threatening to weigh down the stock market’s major indexes. Geopolitical tensions between Israel and Iran, the end to the reciprocal tariff pause, climbing U.S. Treasury yields, and historically pricey stock valuations are just some of the potential downside catalysts at the moment.
Although stock market corrections, bear markets, and even the occasional crash are inevitable, these events all share one thing in common: They’re historically short-lived. The disproportionate nature of stock market cycles overwhelmingly favors investors with an optimistic long-term mindset.
Shortly after the broad-based S&P 500 was confirmed to be in a new bull market in June 2023, the analysts at Bespoke Investment Group published a data set on X (formerly Twitter) that compared the length of every S&P 500 bull and bear market dating back to the start of the Great Depression in September 1929.
It’s official. A new bull market is confirmed.
The S&P 500 is now up 20% from its 10/12/22 closing low. The prior bear market saw the index fall 25.4% over 282 days.
Read more at https://t.co/H4p1RcpfIn. pic.twitter.com/tnRz1wdonp
— Bespoke (@bespokeinvest) June 8, 2023
Bespoke’s data set covered 27 separate S&P 500 bull and bear markets. The 27 bear markets have averaged 286 calendar days in length, which works out to around 9.5 months. Further, none of these 27 bear markets extended beyond 630 calendar days.
Meanwhile, the typical S&P 500 bull market has stuck around for 1,011 calendar days, or roughly two years and nine months. If the current bull market is extrapolated from June 2023 to present day, it means more than half (14 out of 27) of all S&P 500 bull markets since the Great Depression have lasted longer than the lengthiest bear market.
Regardless of the short-term headwinds that stocks are working their way through, being optimistic and allowing time to work in your favor has historically been a moneymaking decision.