GBP/USD Outlook: Testing 41-Month Top Amid Risk-on Flows

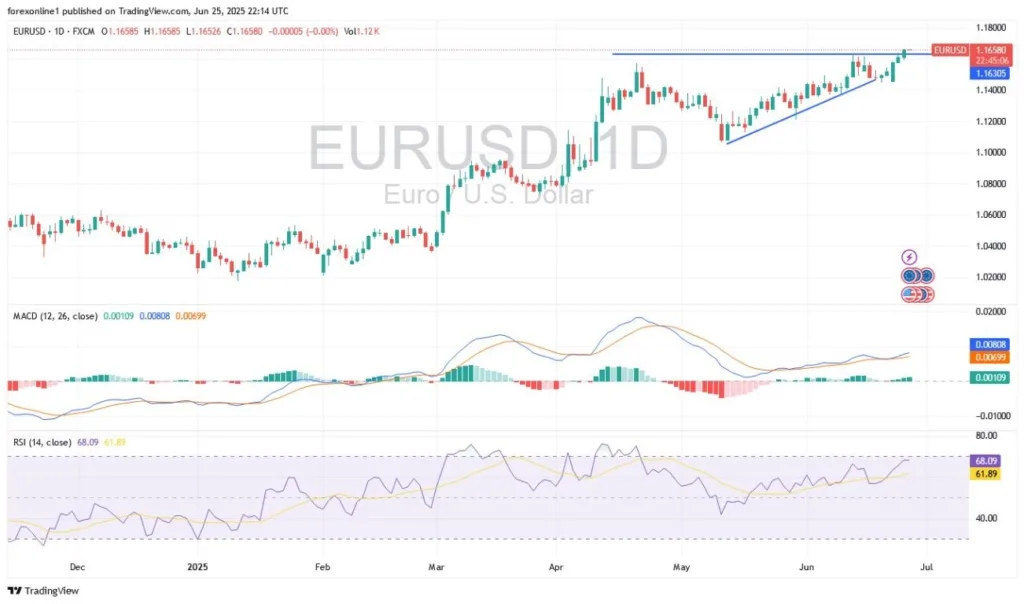
  • The GBP/USD outlook is extremely bullish after the dollar loses further due to Trump’s criticism of the Fed.
  • Iran-Israel ceasefire continues to underpin the global risk sentiment.
  • Markets are now eyeing the Q1 GDP and Core PCE Index data from the US.

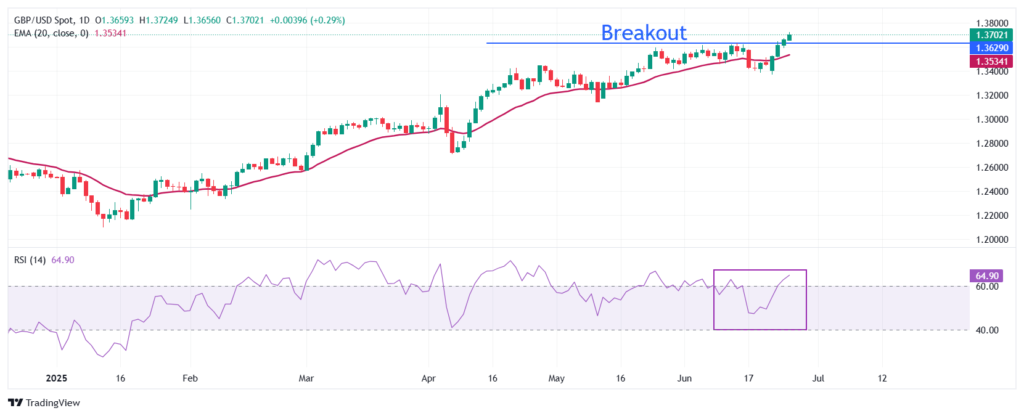
The British pound extended its bullish momentum for the fourth consecutive session on Thursday, pushing the price to a fresh 41-month top near mid-1.3700. The rally stems from improving global risk sentiment and pressure on the US dollar driven by tension in Washington.

Are you interested in learning more about the next cryptocurrency to explode? Check our detailed guide- 

The greenback is experiencing a broader sell-off after President Trump renewed his criticism of the Federal Reserve’s independence. Trump labeled Fed Chair Powell as “terrible” after his testimony before Congress, where he reiterated the data dependence and showed no urgency to lower the rates. The US President also hinted at replacing Powell as soon as this summer. The Dollar Index plunged below 97.50 as markets interpreted Trump’s threat as a political intervention with the central bank.

While the US side faces central bank politics and mixed economic data, the British pound shows resilience. Domestic concerns about a cooling labor market and softer inflation hopes are striking at the pound’s strength. A British Chamber of Commerce survey revealed that around one-third of SMEs plan to cut jobs due to rising National Insurance costs. BoE Governor Bailey also pointed out the softening of the labor market during his testimony earlier this week.

Nevertheless, the markets remain primarily focused on US dynamics and broader risk sentiment. The ceasefire between Iran and Israel has lifted the risk appetite and shifted capital flows off the US dollar. Traders are now eyeing today’s US Q1 GDP and Friday’s US Core PCE Index report. Softer-than-expected data may increase the odds of a September rate cut, which will further weaken the US dollar.

GBP/USD Technical Outlook: Bulls Aim for 1.4000

GBP/USD Technical OutlookGBP/USD Technical Outlook
GBP/USD 4-hour chart

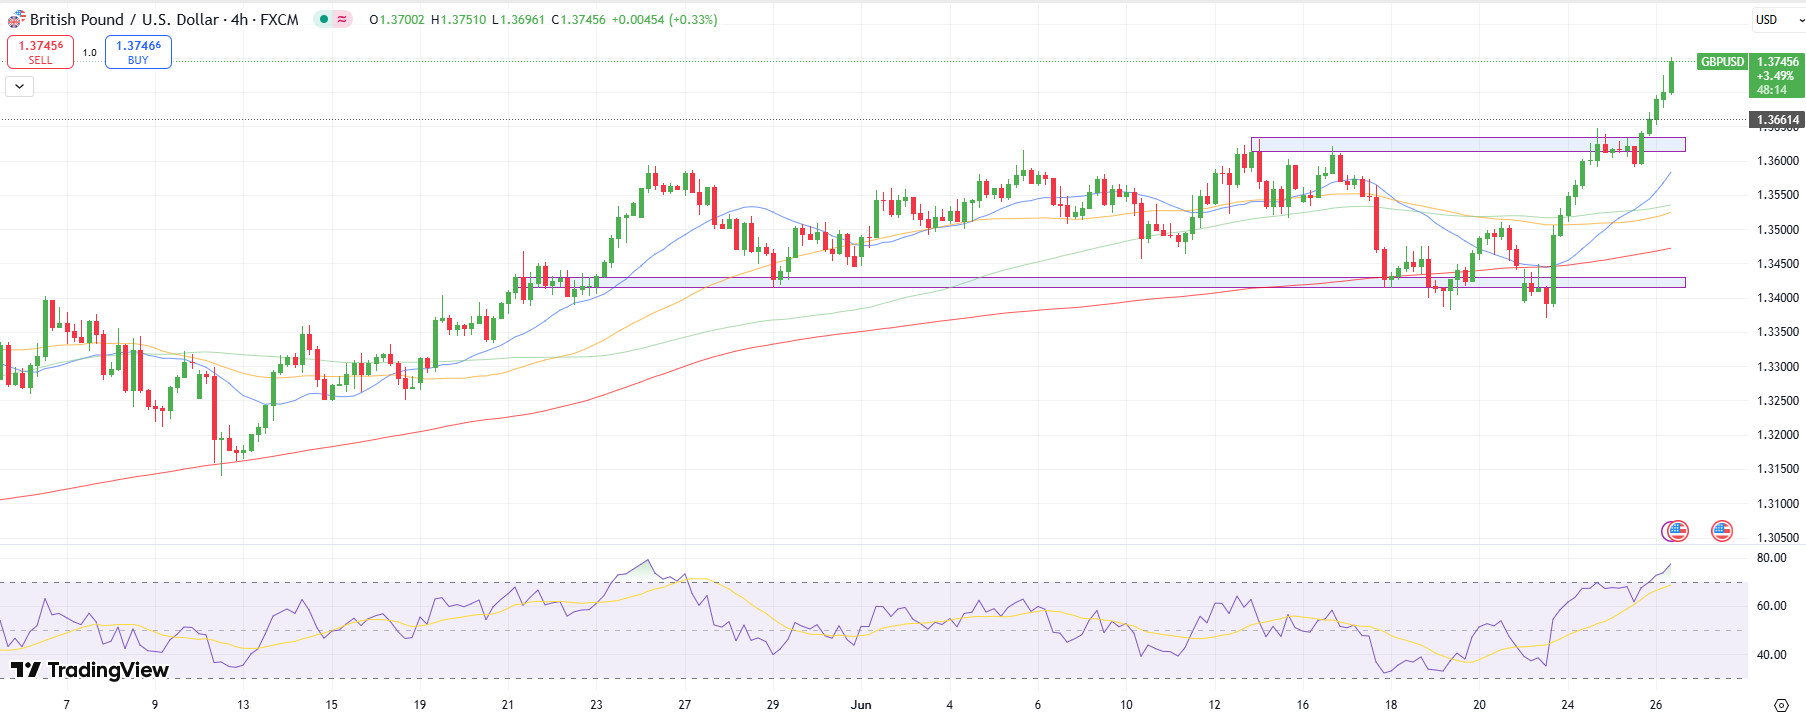
The 4-hour chart of the GBP/USD reveals a strong bullish trend as the price lies well above the key SMAs. The pair broke the resistance at 1.3635 with a strong push towards 1.3750. The price is building the case to test the 1.4000 psychological mark.

Are you interested in learning more about forex indicators? Check our detailed guide-

On the other hand, the pair may experience profit-taking as it has overextended, and the RSI indicates an extreme overbought condition near the 80.0 level. The pair may test the resistance-turned-support at 1.3635 before resuming the uptrend.

Looking to trade forex now? Invest at eToro!

68% of retail investor accounts lose money when trading CFDs with this provider. You should consider whether you can afford to take the high risk of losing your money.

Source link

Visited 1 times, 1 visit(s) today

Related Article

EUR/USD Analysis Today 26/06: Selling Recommended (Chart)

EUR/USD Analysis Today 26/06: Selling Recommended (Chart)

EUR/USD Analysis Summary Today Overall Trend: Strongly Bullish. Today’s EUR/USD Support Levels: 1.1590 – 1.1500 – 1.1420. Today’s EUR/USD Resistance Levels: 1.1680 – 1.1730 – 1.1800. EUR/USD Trading Signals: Sell EUR/USD from the resistance level of 1.1690 with a target of 1.1400 and a stop-loss at 1.1800. Buy EUR/USD from the support level of 1.1490

Nvidia Stock Price Could Soar to Hit $6 Trillion Valuation: Loop Capital

Nvidia Stock Price Could Soar to Hit $6 Trillion Valuation: Loop Capital

Nvidia shares hit a record high on Wednesday, closing at $154.31 and lifting the chipmaker’s market value to $3.77 trillion. The move allowed the AI titan to reclaim the title of the world’s most valuable company — but one firm thinks the rally isn’t even close to being over. The stock extended its record high

Gold Analysis Today 26/06: Attempts to Halt Losses (Chart)

Attempts to Halt Losses (Chart)

Today’s Gold Analysis Overview: The overall Gold Trend: Neutral, with an upward opportunity still present. Today’s Gold Support Levels: $3310 – $3275 – $3190 per ounce. Today’s Gold Resistance Levels: $3360 – $3400 – $3430 per ounce. Today’s gold trading signals update: Sell Gold from the resistance level of $3375 with a target of $3290

A person throwing dollars.

Can Investing $10,000 in Nvidia Stock Make You a Millionaire?

Nvidia (NVDA 4.26%) stock has lost some of its momentum this year after gaining 1,400% over the past five years. It’s lost some investor confidence for a number of reasons, including fears that new artificial intelligence (AI) models won’t need its powerful chips and regulations that limit what the company can ship to China. But

NZD/USD Analysis Today 26/06: Reversal Up (Chart)

NZD/USD Analysis Today 26/06: Reversal Up (Chart)

The NZD/USD has recovered it bullish stance and is simmering within the higher elements of its near-term value as financial institutions likely consider higher potential targets amidst USD weakness. The NZD/USD is near the 0.60710 ratio as of this writing. The value of the currency pair is touching its weekly highs as it fluctuates in

Pound Sterling surges, Shell dimisses speculation of BP takeover

Pound Sterling surges, Shell dimisses speculation of BP takeover

The Pound Sterling climbs to near 1.3765 against the US Dollar on hopes that President Trump will announce Fed Powell’s successor soon. Fed’s Powell warned that the tariff-driven inflation could prove to be persistent. UK employers aim to reduce their labor force to offset the impact of the increase in contributions to social security schemes.

0
Would love your thoughts, please comment.x
()
x