A reader asks:
I was reading your post “3% Market Returns For The Next Decade” and it got me thinking about something you wrote about a few years ago — the John Bogle Expected Return Formula. I don’t remember how you were able to get the numbers to calculate the formula, but I’d love to see an update about what the formula says today.
I came across the Bogle Expected Returns Formula in his book Don’t Count On It.
Bogle looked back at the history of stock market performance going back to 1900 by breaking down returns into three main components:
1. Dividend yield
2. Earnings growth
3. The speculative return or change in valuations
Bogle broke out these return variables by decade to show where stock market performance comes from:
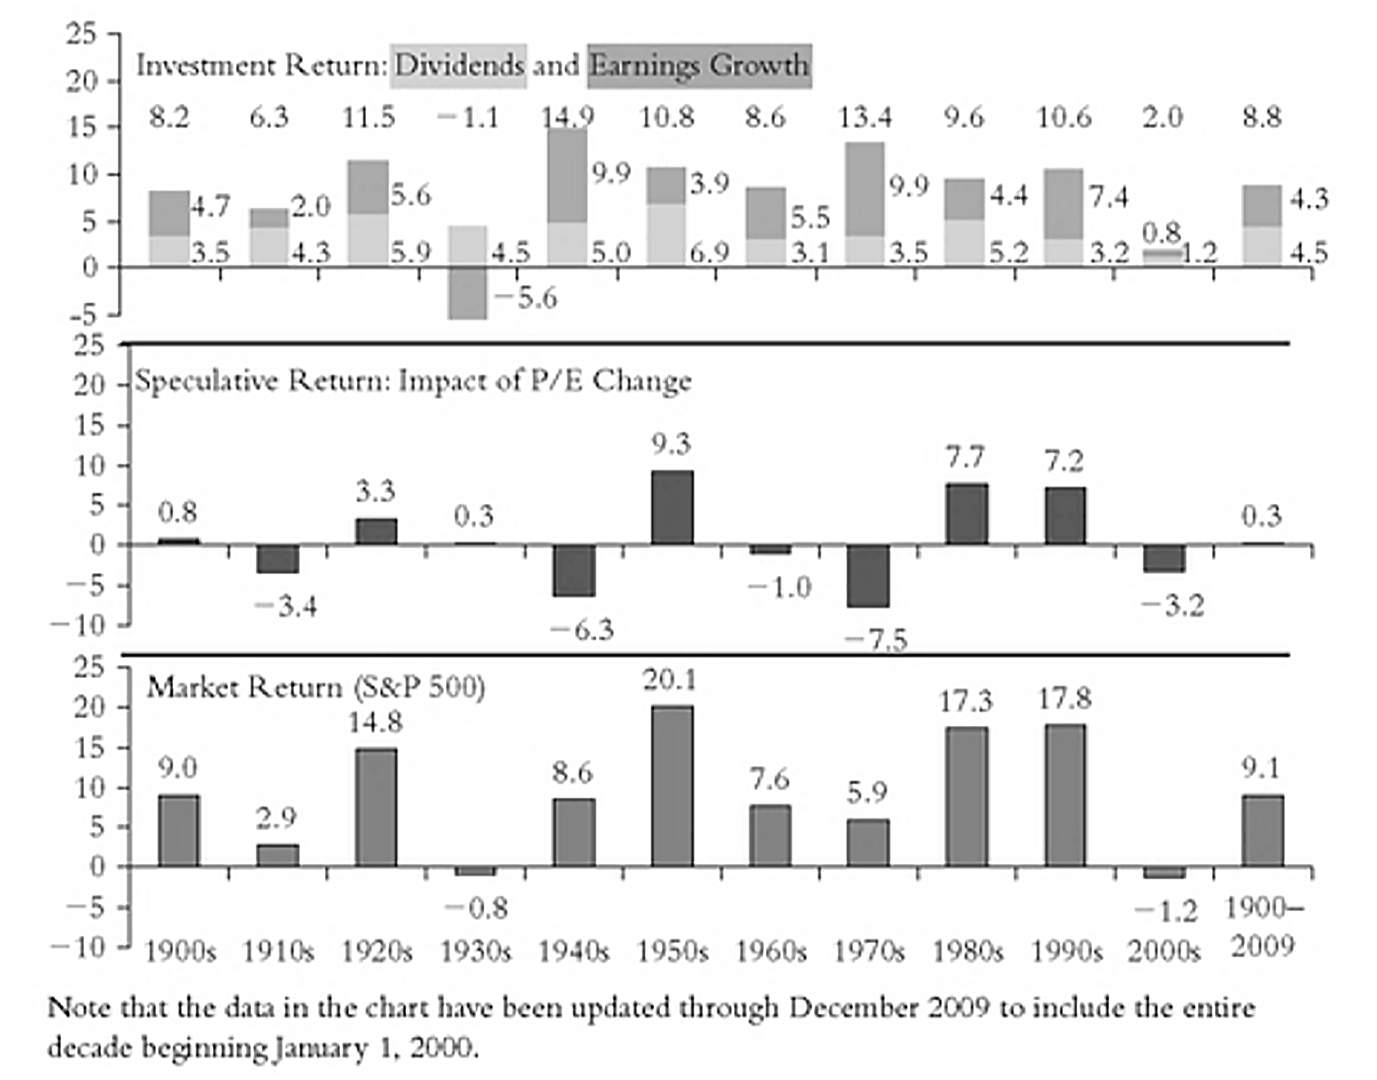
The 9.1% return from 1900-2009 was made up of mostly dividends (4.3%) and earnings growth (4.5%) with little change in the speculative element (0.3%). But the individual decades are all over the place.
There have been decades with average fundamentals but highly speculative returns (1950s), poor fundamentals with little change in the speculative return (1930s) and good fundamentals with poor valuations (1970s).
Obviously, there are reasons for each environment. Context matters.
Then Bogle used that same formula to come up with expected returns for the next decade:
The stock return over the coming decade is projected at 7 percent, based on today’s dividend yield of about 2 percent and prospective nominal earnings growth of about 6 percent, with a shading for the slightly lower price-earnings ratio that I expect a decade hence.
Here’s a chart from the book:
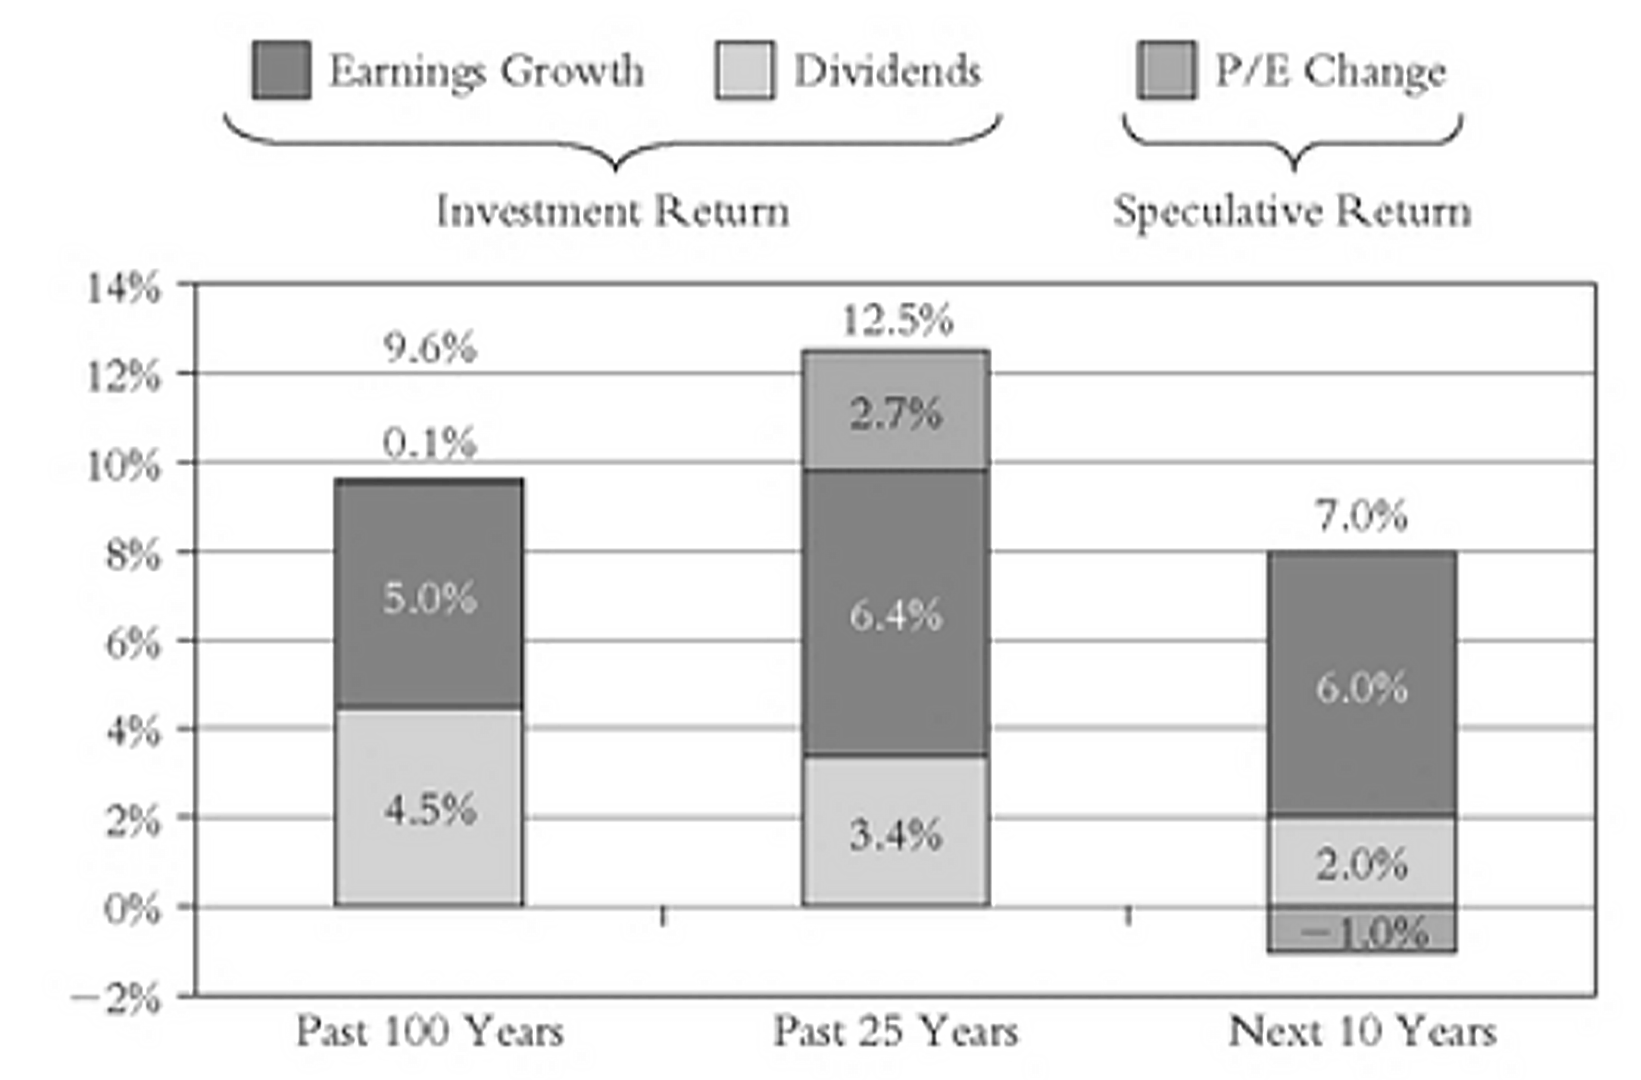
The below-average return forecast was the result of speculative returns being so high in recent decades and starting dividend yields being so low. At the time this sounded reasonable. Lots of people were forecasting lower returns following the Great Financial Crisis.
Remember the new normal?
This book was published in the fall of 2010, so we can see how the actual returns compare to the forecast.
Over the 10 years from 2011 to 2020, the Vanguard Total Stock Market Index Fund was up 263% in total or 13.8% annualized, nearly double Bogle’s forecast.
So where did Bogle’s assumptions go wrong?
I’ve updated his formula through 2025:
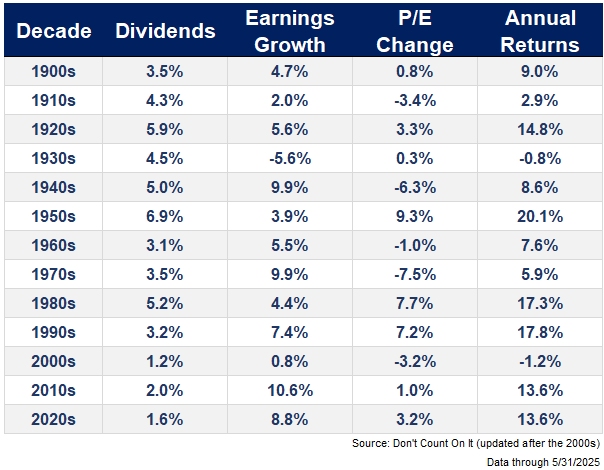
Earnings growth in the 2010s and 2020s have been much higher than expected and valuations have continued to increase.
To be fair to Saint Jack1, no one was predicting the tech stock dominance that was coming. These corporations became high-margin, hyperscaler, high-growth, cash-flow-producing machines.
It’s also surprising that we had 13.6% annual returns in the 2010s and have matched those same returns in the 2020s (so far).
The past is great and all but investors care more about what happens in the future.
The current dividend yield of the U.S. stock market is 1.3%. Let’s assume technology and AI keep earnings growth above average from productivity and efficiency gains — call it 7-8%. On pure fundamentals alone, that’s pretty good, even if my earnings estimates are too high.
The unanswerable question is how do investors feel about stocks? That’s all valuations are, is feelings.
Depending on the environment, sometimes investors are willing to pay more for earnings and sometimes less.
Risk appetite has been strong throughout the 2020s. It feels like that will continue at the moment but who knows what the market gods will throw at us in the coming years.
This exercise is a good reminder of the difficulty in predicting the future. Your earnings forecast could be spot on in the years ahead and you still probably won’t be able to estimate forward returns from here.
That’s not to say that fundamentals don’t matter. Of course they do…over the long run.
I’ll give the final word on this to Bogle:
Over the very long run, it is the economics of investing–enterprise–that has determined total return; the evanescent emotions of investing–speculation–so important over the short run, have ultimately proven to be virtually meaningless.
Amen.
I did a deep dive on this question for this week’s Ask the Compound:
Callie Cox joined me on the show to discuss viewer questions about my typical work day, how personal experiences shape your investment views, how to hedge a falling dollar, saving too much money and how much is too much for a single stock position.
Further Reading:
3% Returns For the Next Decade?
1Bogle has done more than anyone in history to lower costs and offer better investment options for the masses.